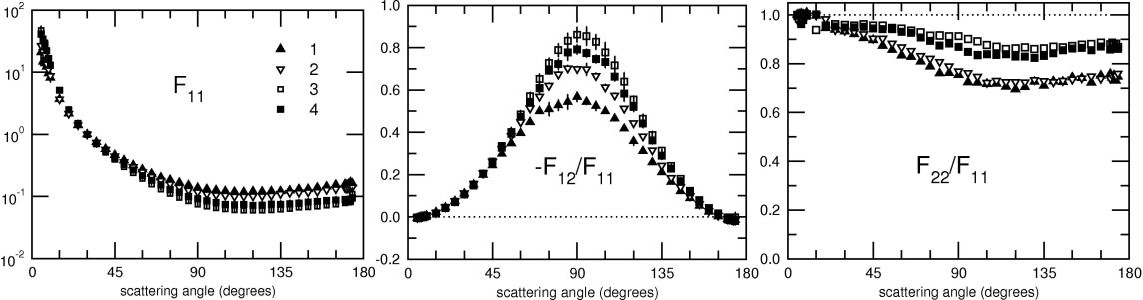
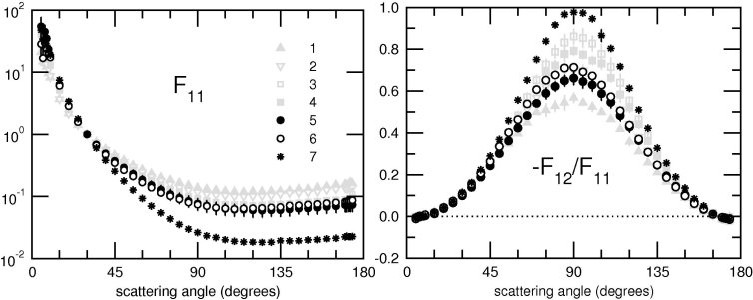
| Aggregate (fluffy) Sample 1 |
|
View |
632.8 nm (filled triangles) (plot, table) |
|
Volten et al. 2007
|
| Aggregate (fluffy) Sample 2 |
|
View |
632.8 nm (open triangles) (plot, table) |
|
Volten et al. 2007
|
| Aggregate (fluffy) Sample 3 |
|
View |
632.8 nm (open squares) (plot, table) |
|
Volten et al. 2007
|
| Aggregate (fluffy) Sample 4 |
|
View |
632.8 nm (filled squares) (plot, table) |
|
Volten et al. 2007
|
| Aggregate (fluffy) Sample 5 |
|
|
632.8 nm (filled circles) (plot, table) |
|
Volten et al. 2007
|
| Aggregate (fluffy) Sample 6 |
|
|
632.8 nm (open circles) (plot, table) |
|
Volten et al. 2007
|
| Aggregate (fluffy) Sample 7 |
|
View |
632.8 nm (asterisks) (plot, table) |
|
Volten et al. 2007
|
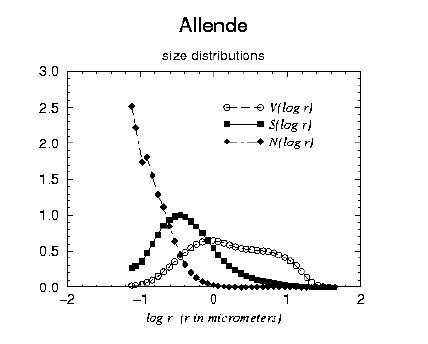
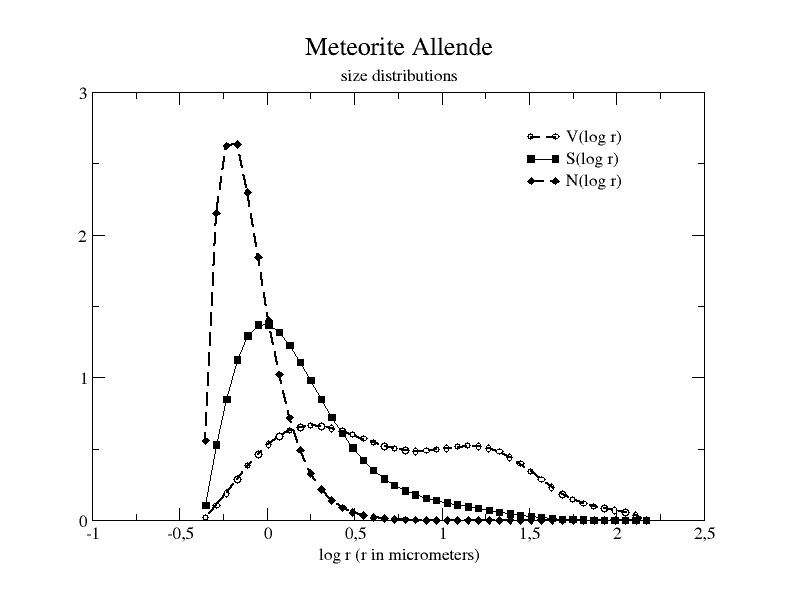
| Allende (Amsterdam) |
plot, table
|
View |
441.6nm (plot, table)
632.8nm (plot, table) |
|
Muñoz et al. 2000
|
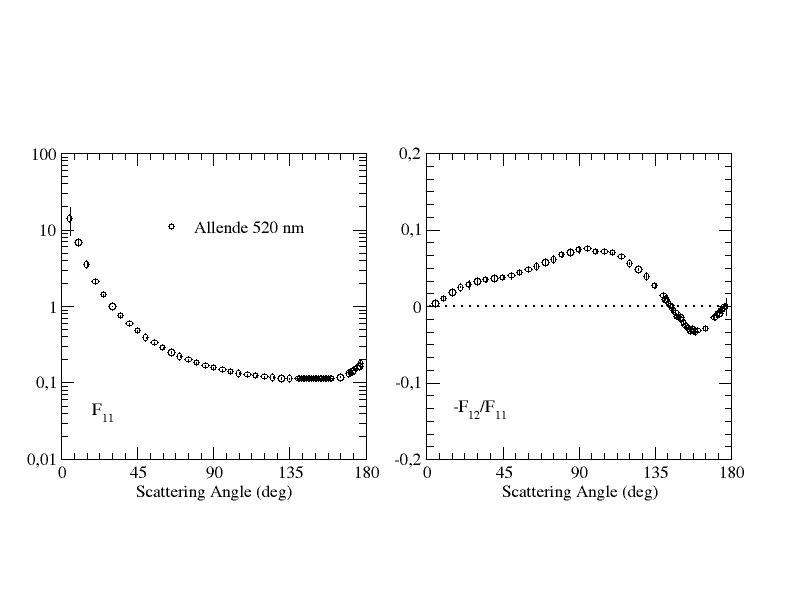
| Allende (Granada) |
plot, table
|
View |
520 nm (plot, table) |
520 nm (tableM, tableF) |
Fratin et al. 2019
|
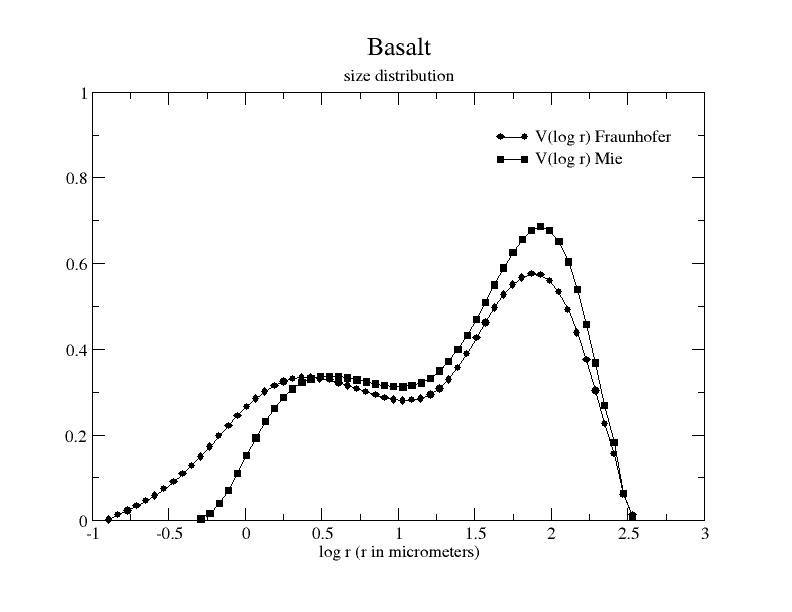
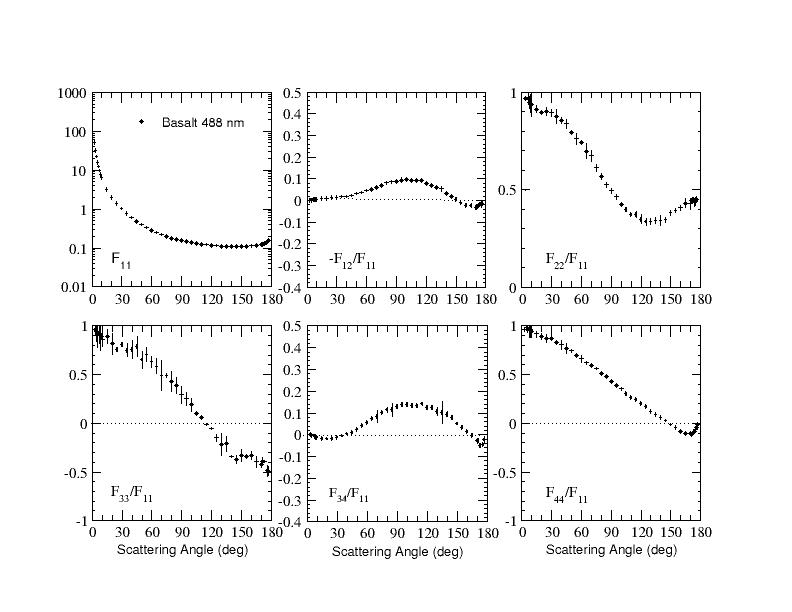
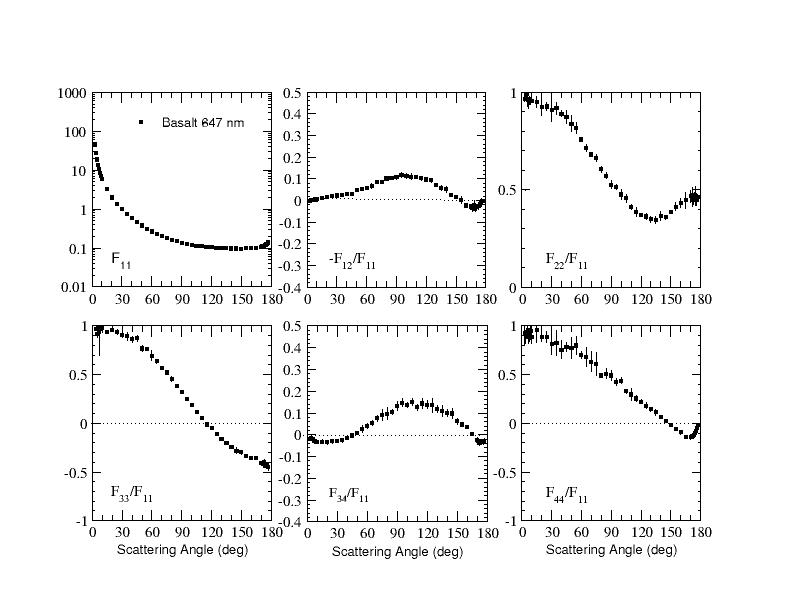
| Basalt |
plot, table
|
View |
488 nm (plot, table)
647 nm (plot, table) |
488 nm (tableM, tableF)
647 nm (tableM, tableF) |
Dabrowska et al. 2015
|
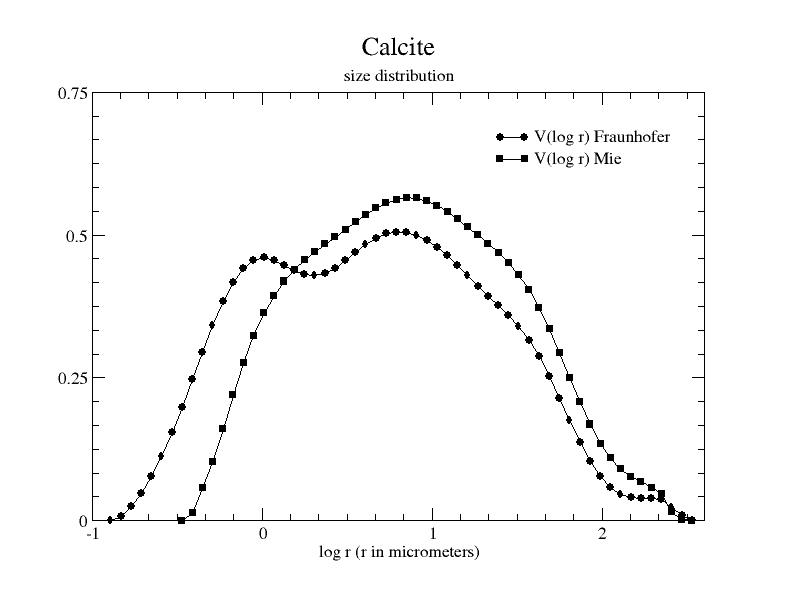
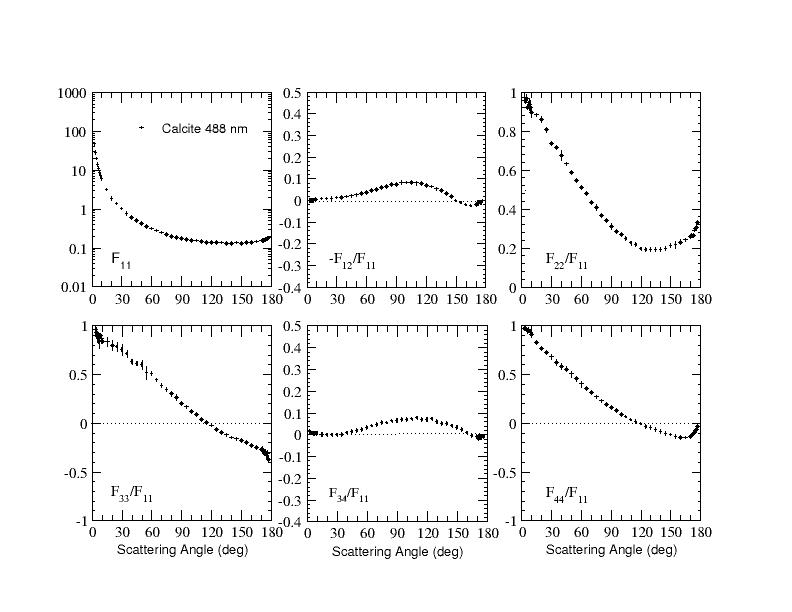
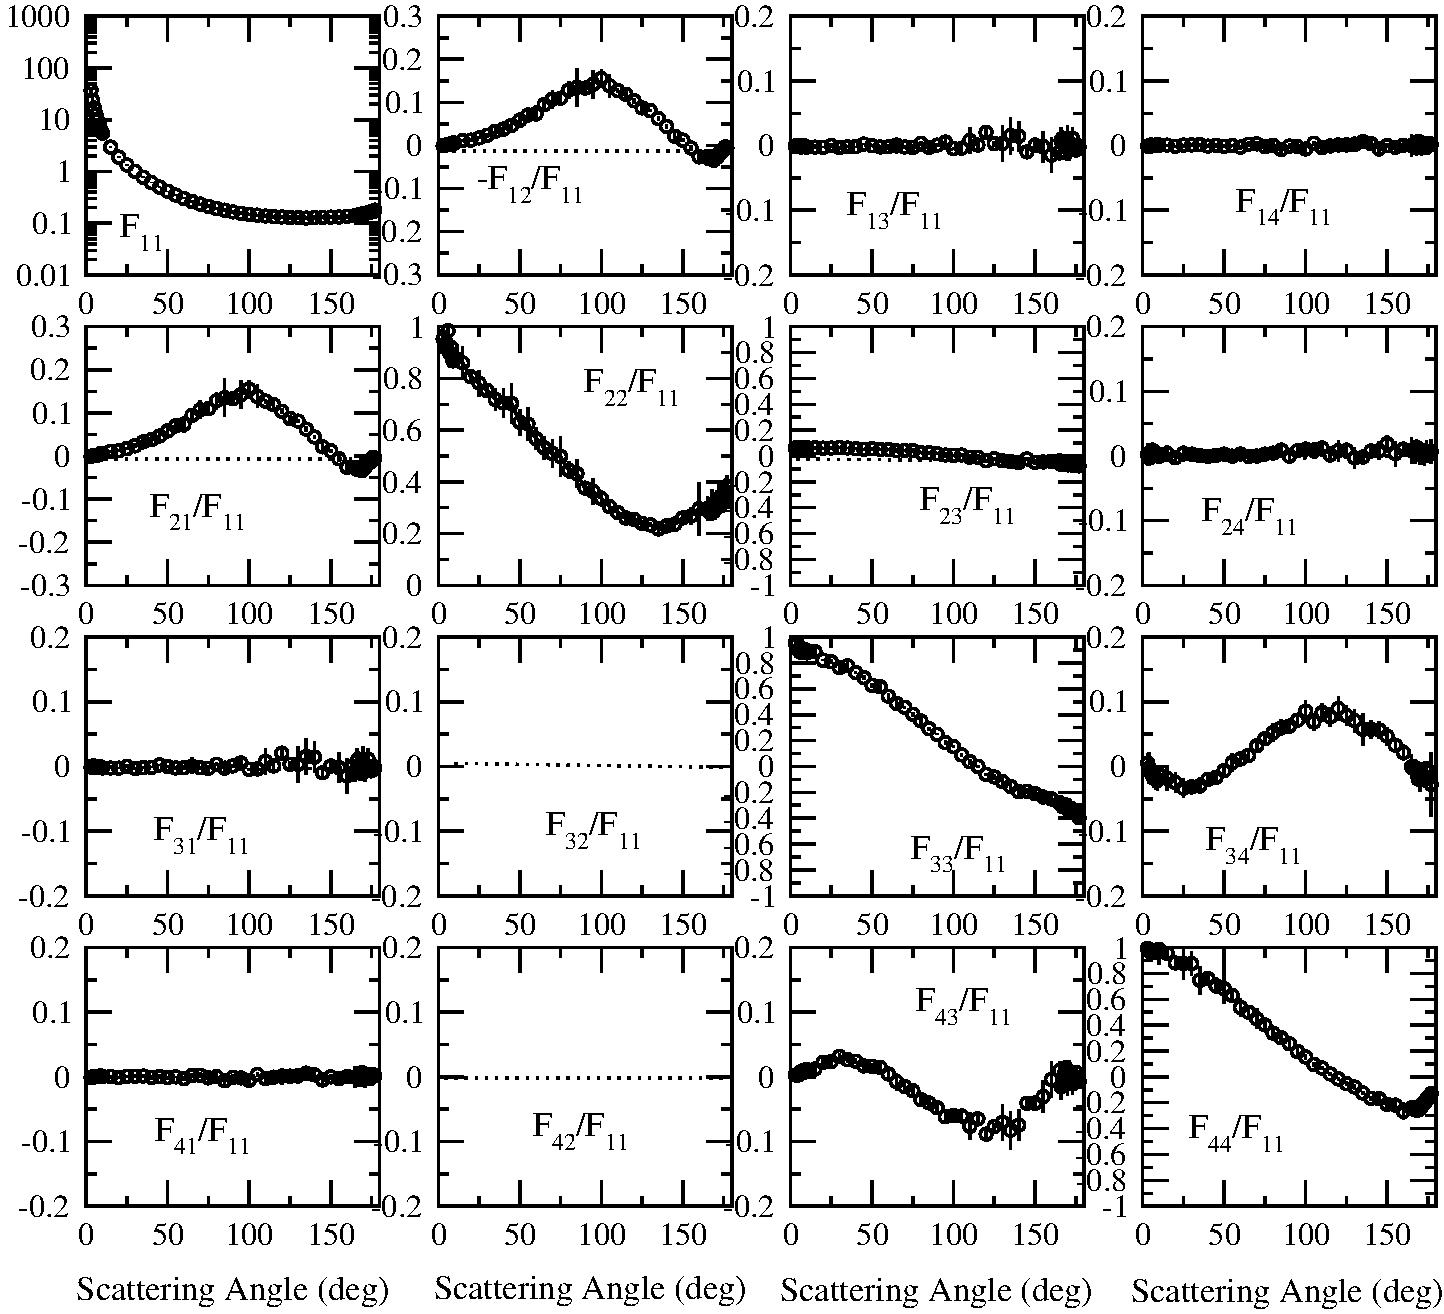
| Calcite |
plot, table
|
View |
488 nm (plot, table)
647 nm (plot, table) |
488 nm (tableM, tableF) |
Dabrowska et al. 2013
Dabrowska et al. 2015
|
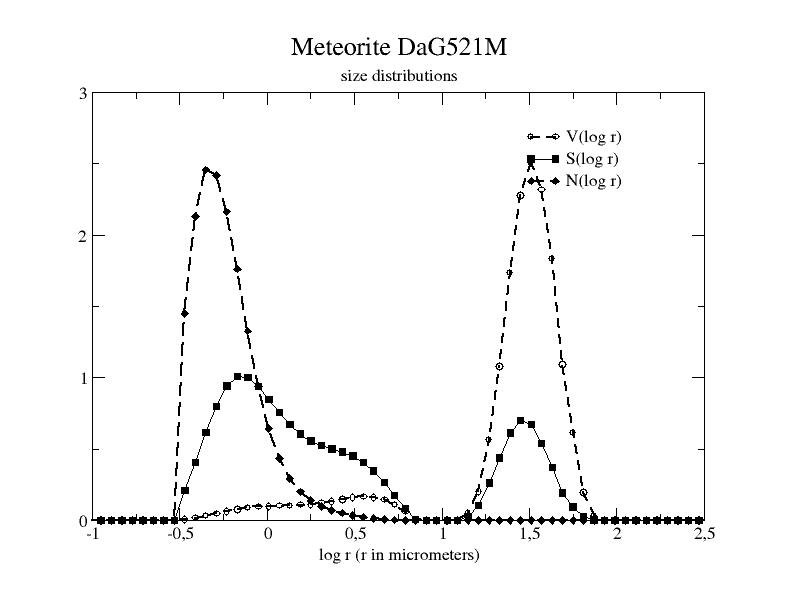
| DaG521M |
plot, table
|
View |
520 nm (plot, table) |
520 nm (tableM, tableF) |
Fratin et al. 2019
|
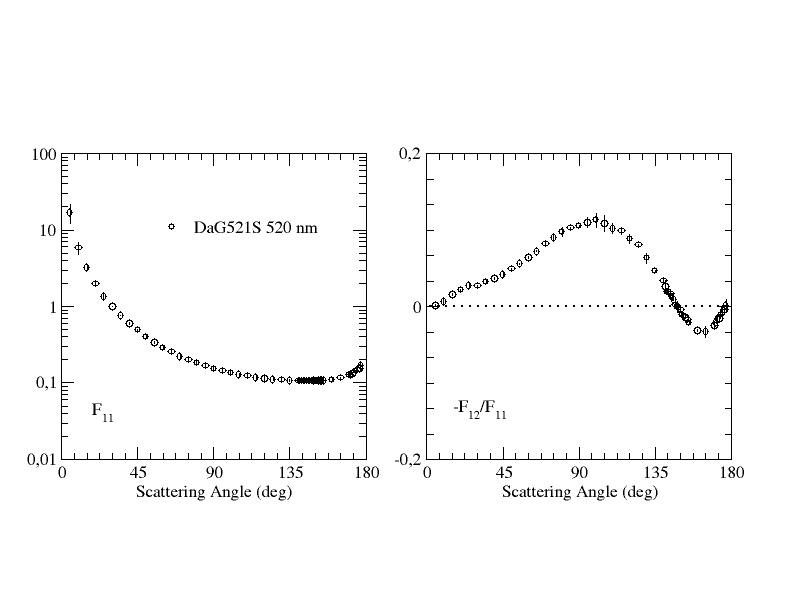
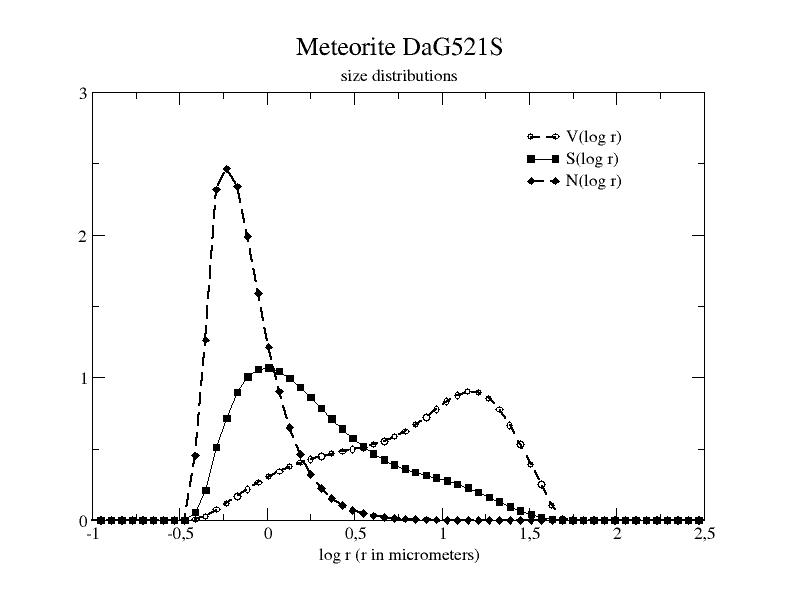
| DaG521S |
plot, table
|
View |
520 nm (plot, table) |
520 nm (tableM, tableF) |
Fratin et al. 2019
|
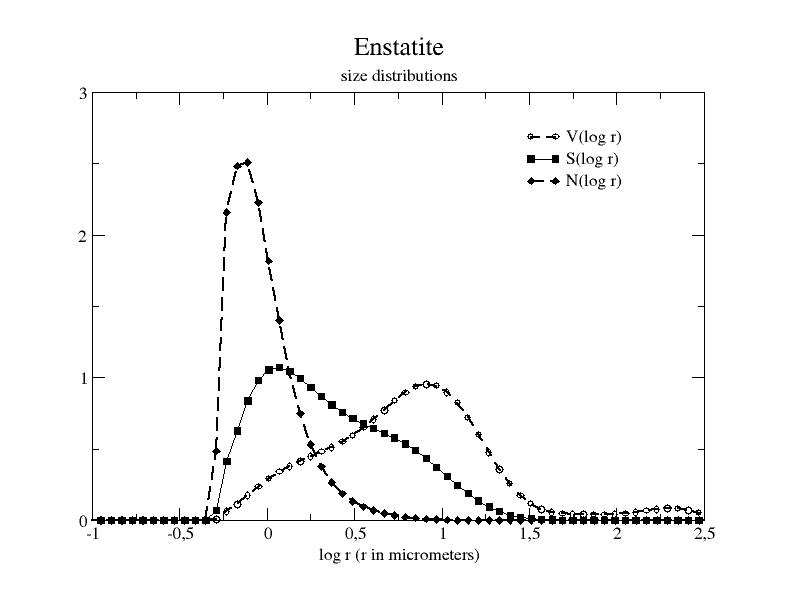
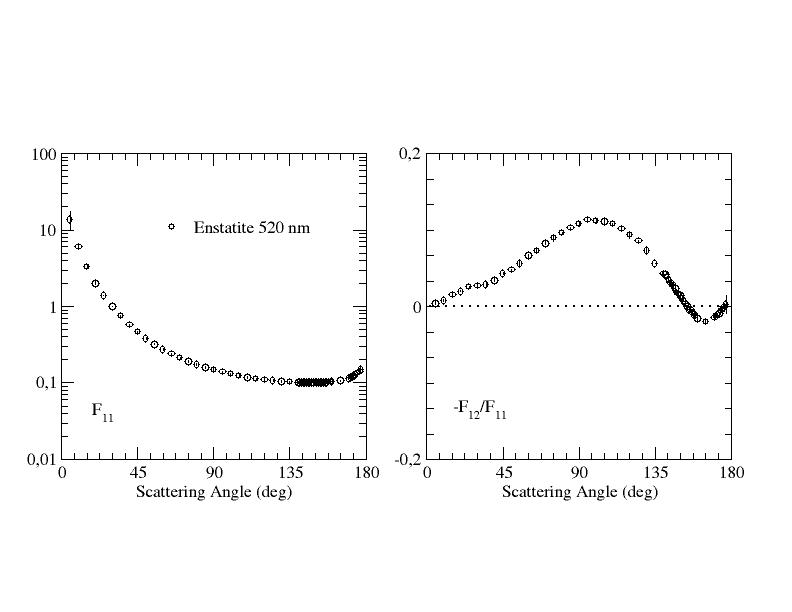
| Enstatite |
plot, table
|
View |
520 nm (plot, table) |
520 nm (tableM, tableF) |
Fratin et al. 2019
|
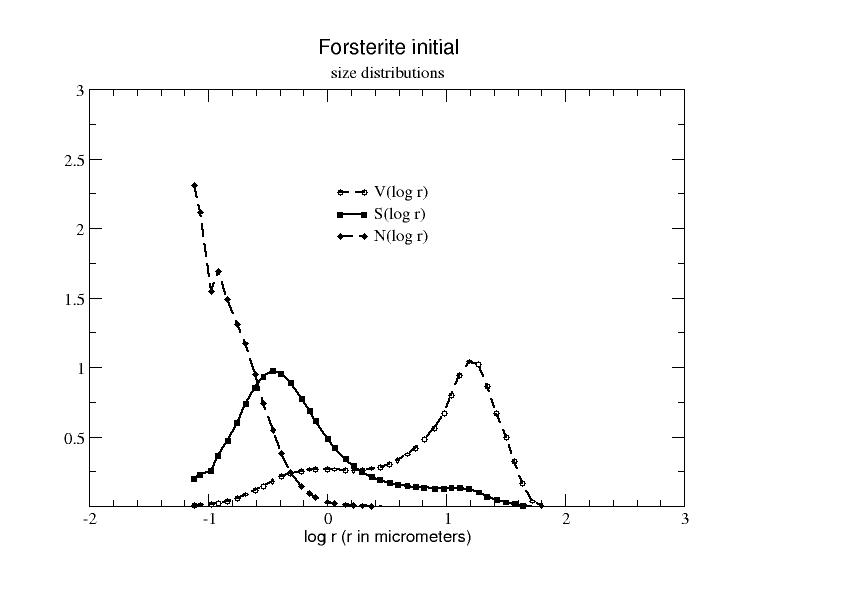
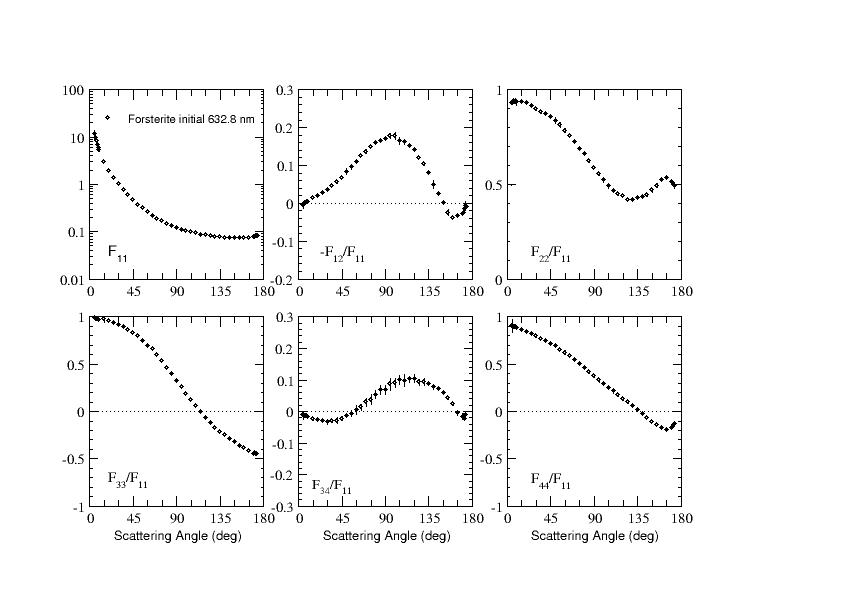
| Forsterite Initial |
plot, table
|
View |
632.8 nm (plot, table) |
|
Volten et al. 2006
|
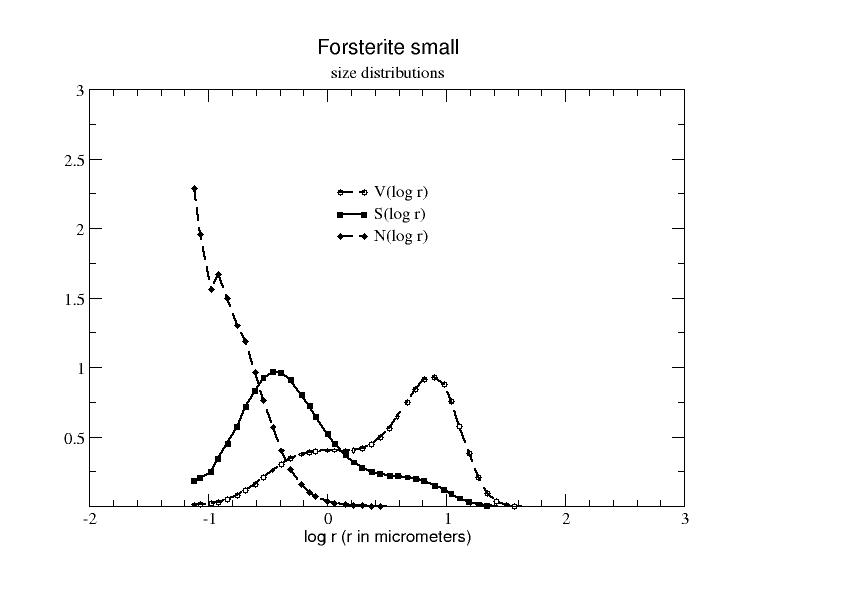
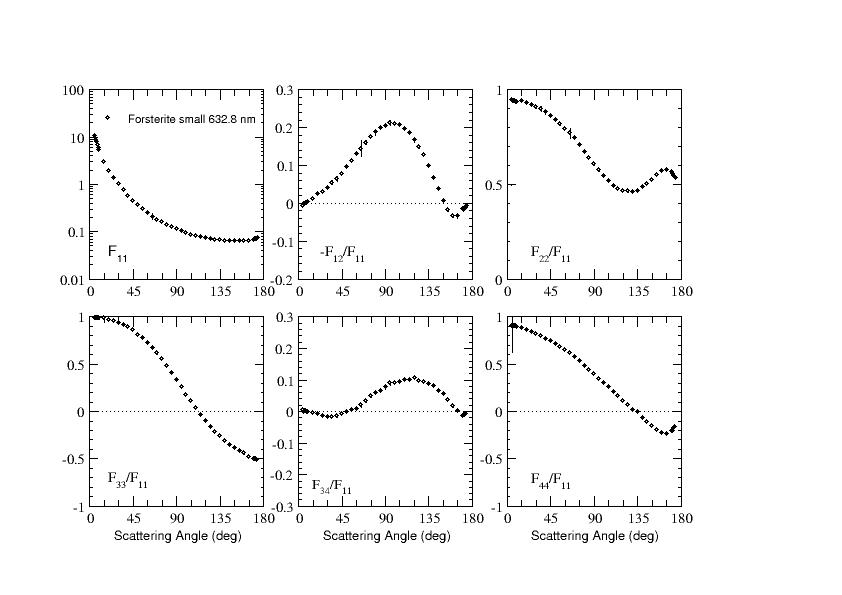
| Forsterite Small |
plot, table
|
View |
632.8 nm (plot, table) |
|
Volten et al. 2006
|
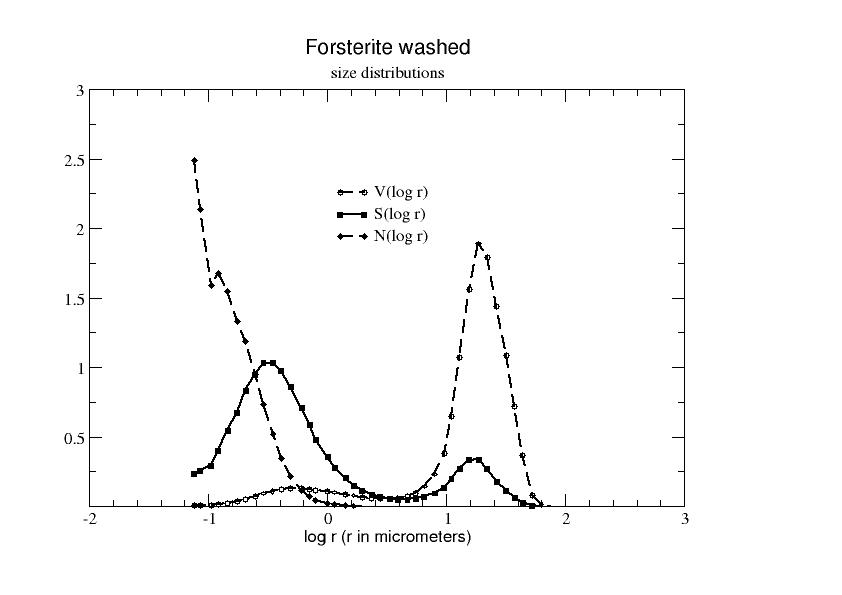
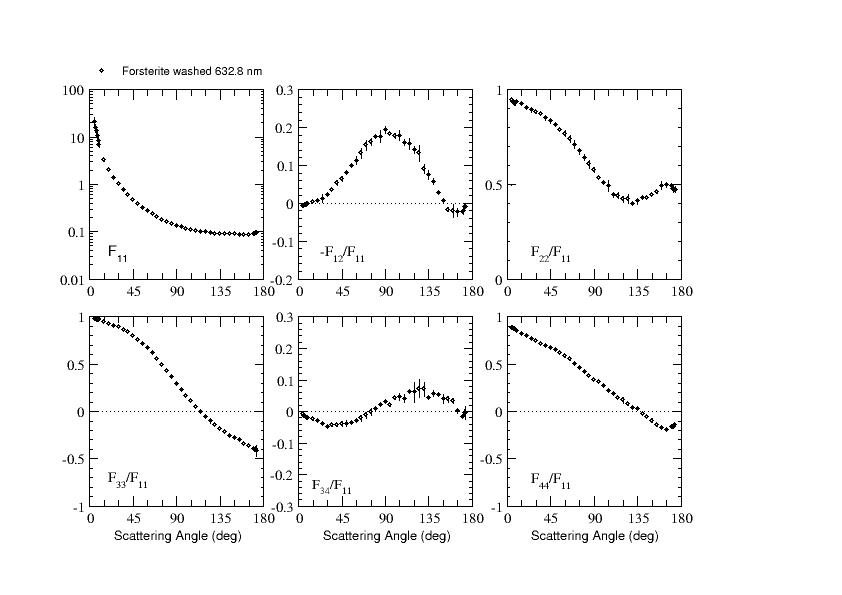
| Forsterite Washed |
plot, table
|
View |
632.8 nm (plot, table) |
|
Volten et al. 2006
|
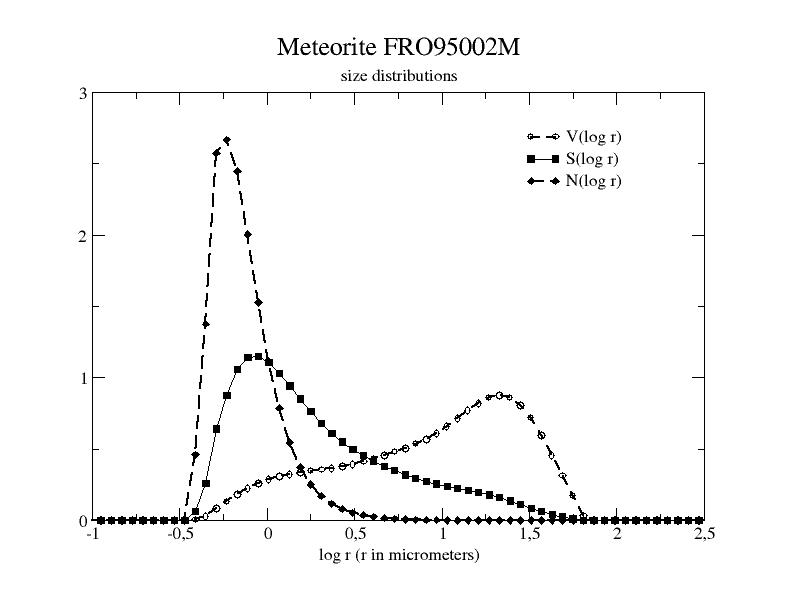
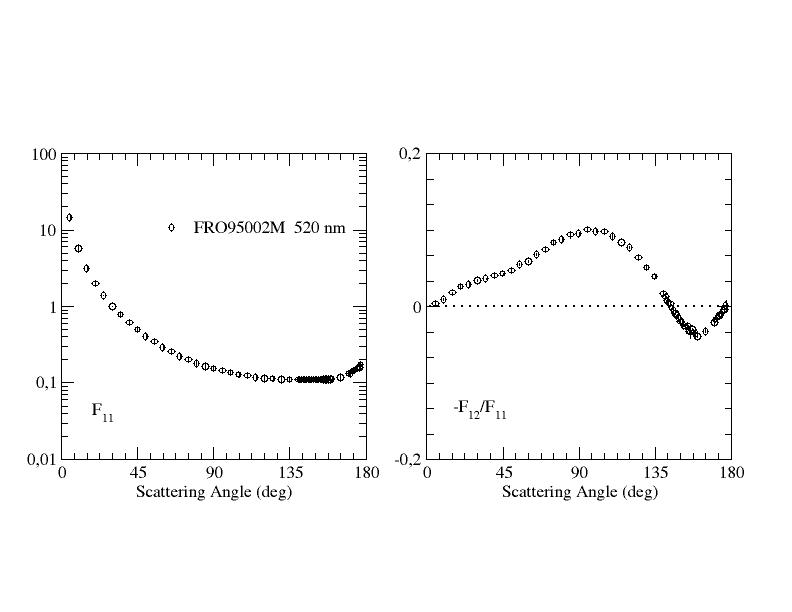
| FRO95002M |
plot, table
|
View |
520 nm (plot, table) |
520 nm (tableM, tableF) |
Fratin et al. 2019
|
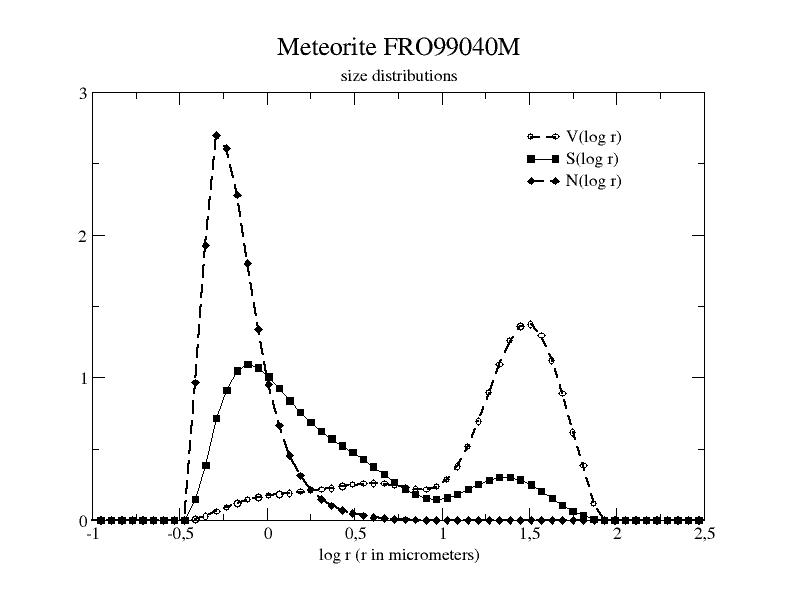
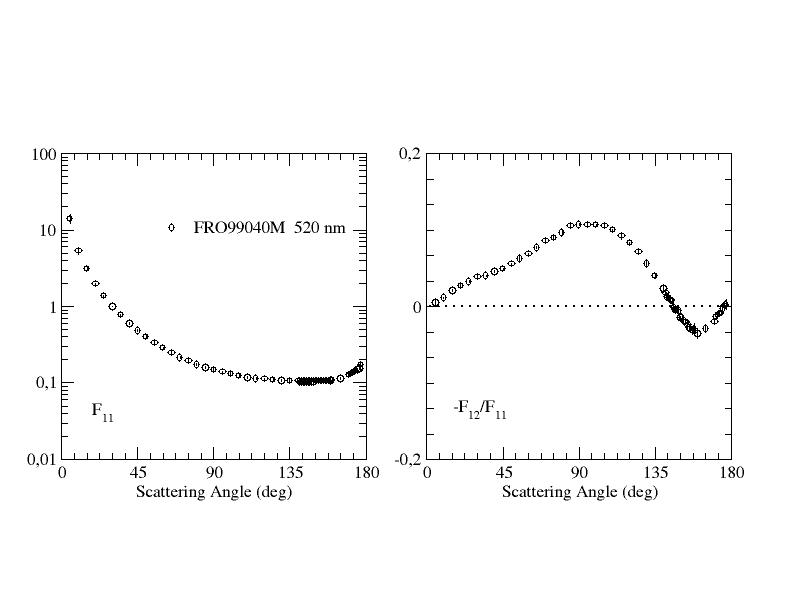
| FRO99040M |
plot, table
|
View |
520 nm (plot, table) |
520 nm (tableM, tableF) |
Fratin et al. 2019
|
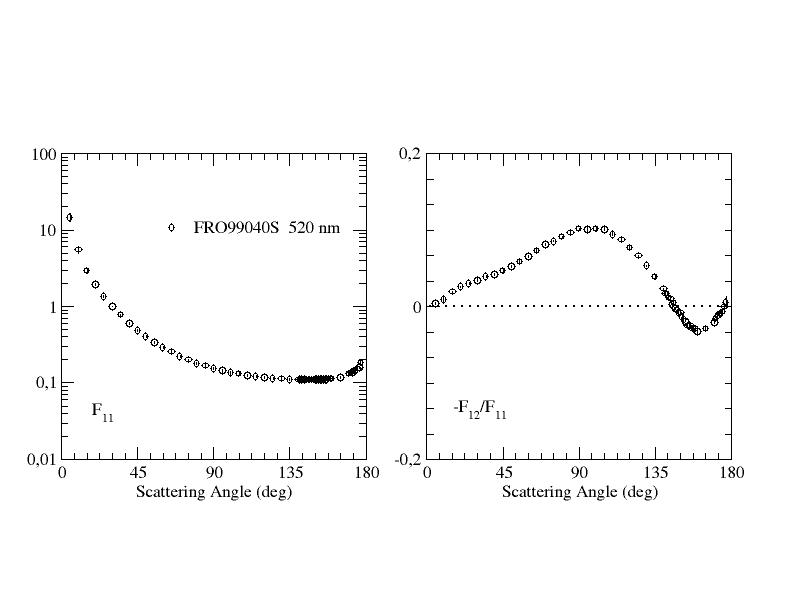
| FRO99040S |
plot, table
|
View |
520 nm (plot, table) |
520 nm (tableM, tableF) |
Fratin et al. 2019
|
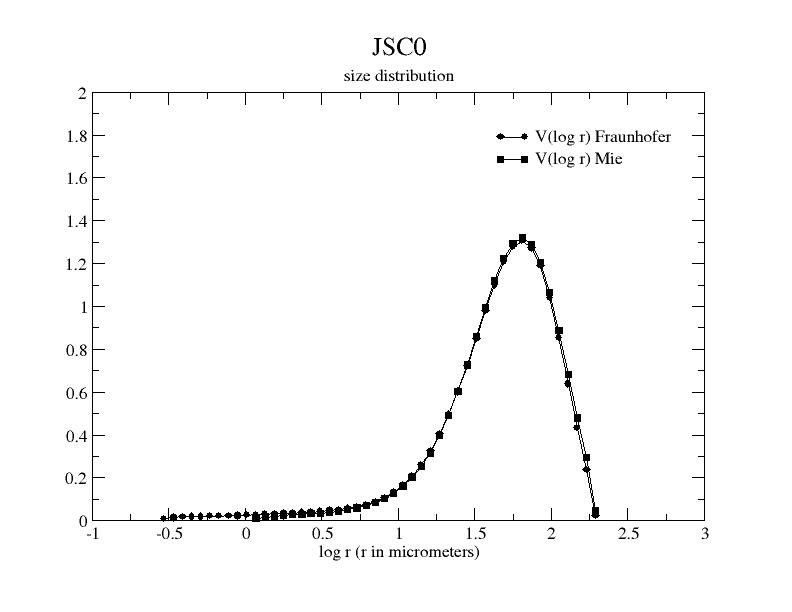
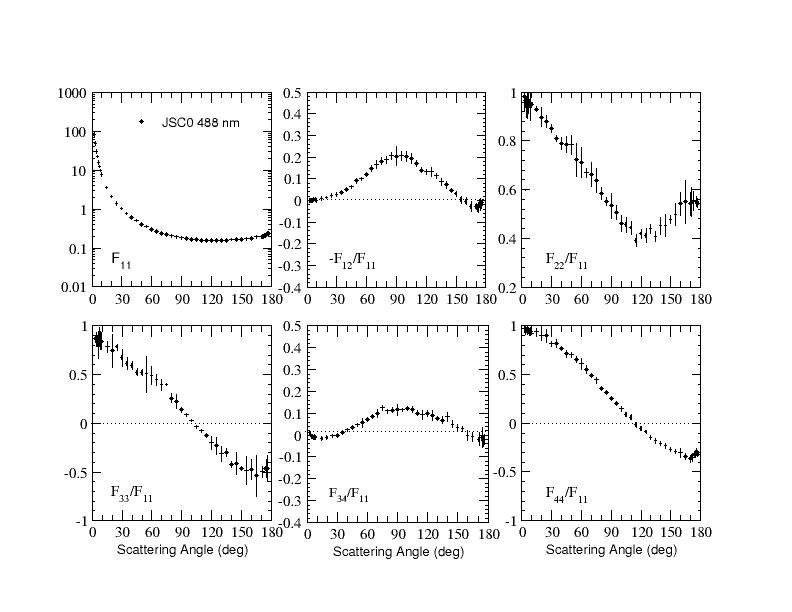
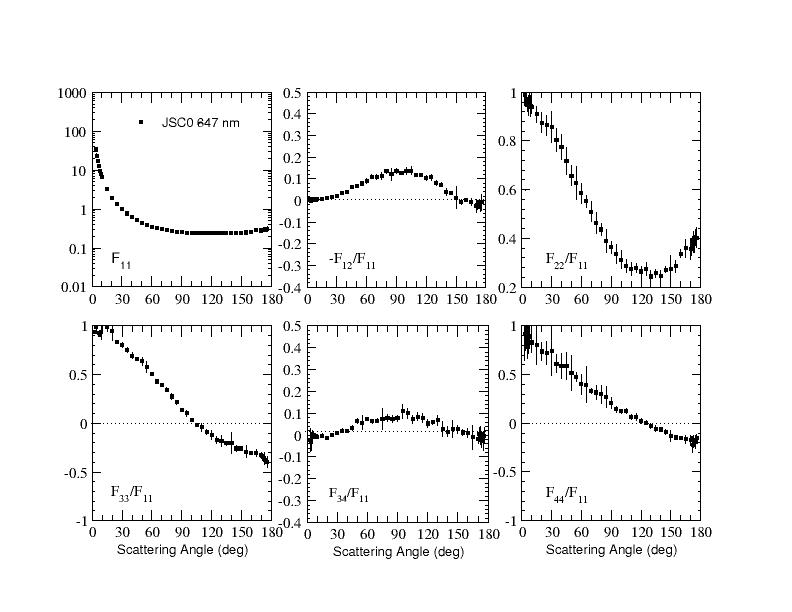
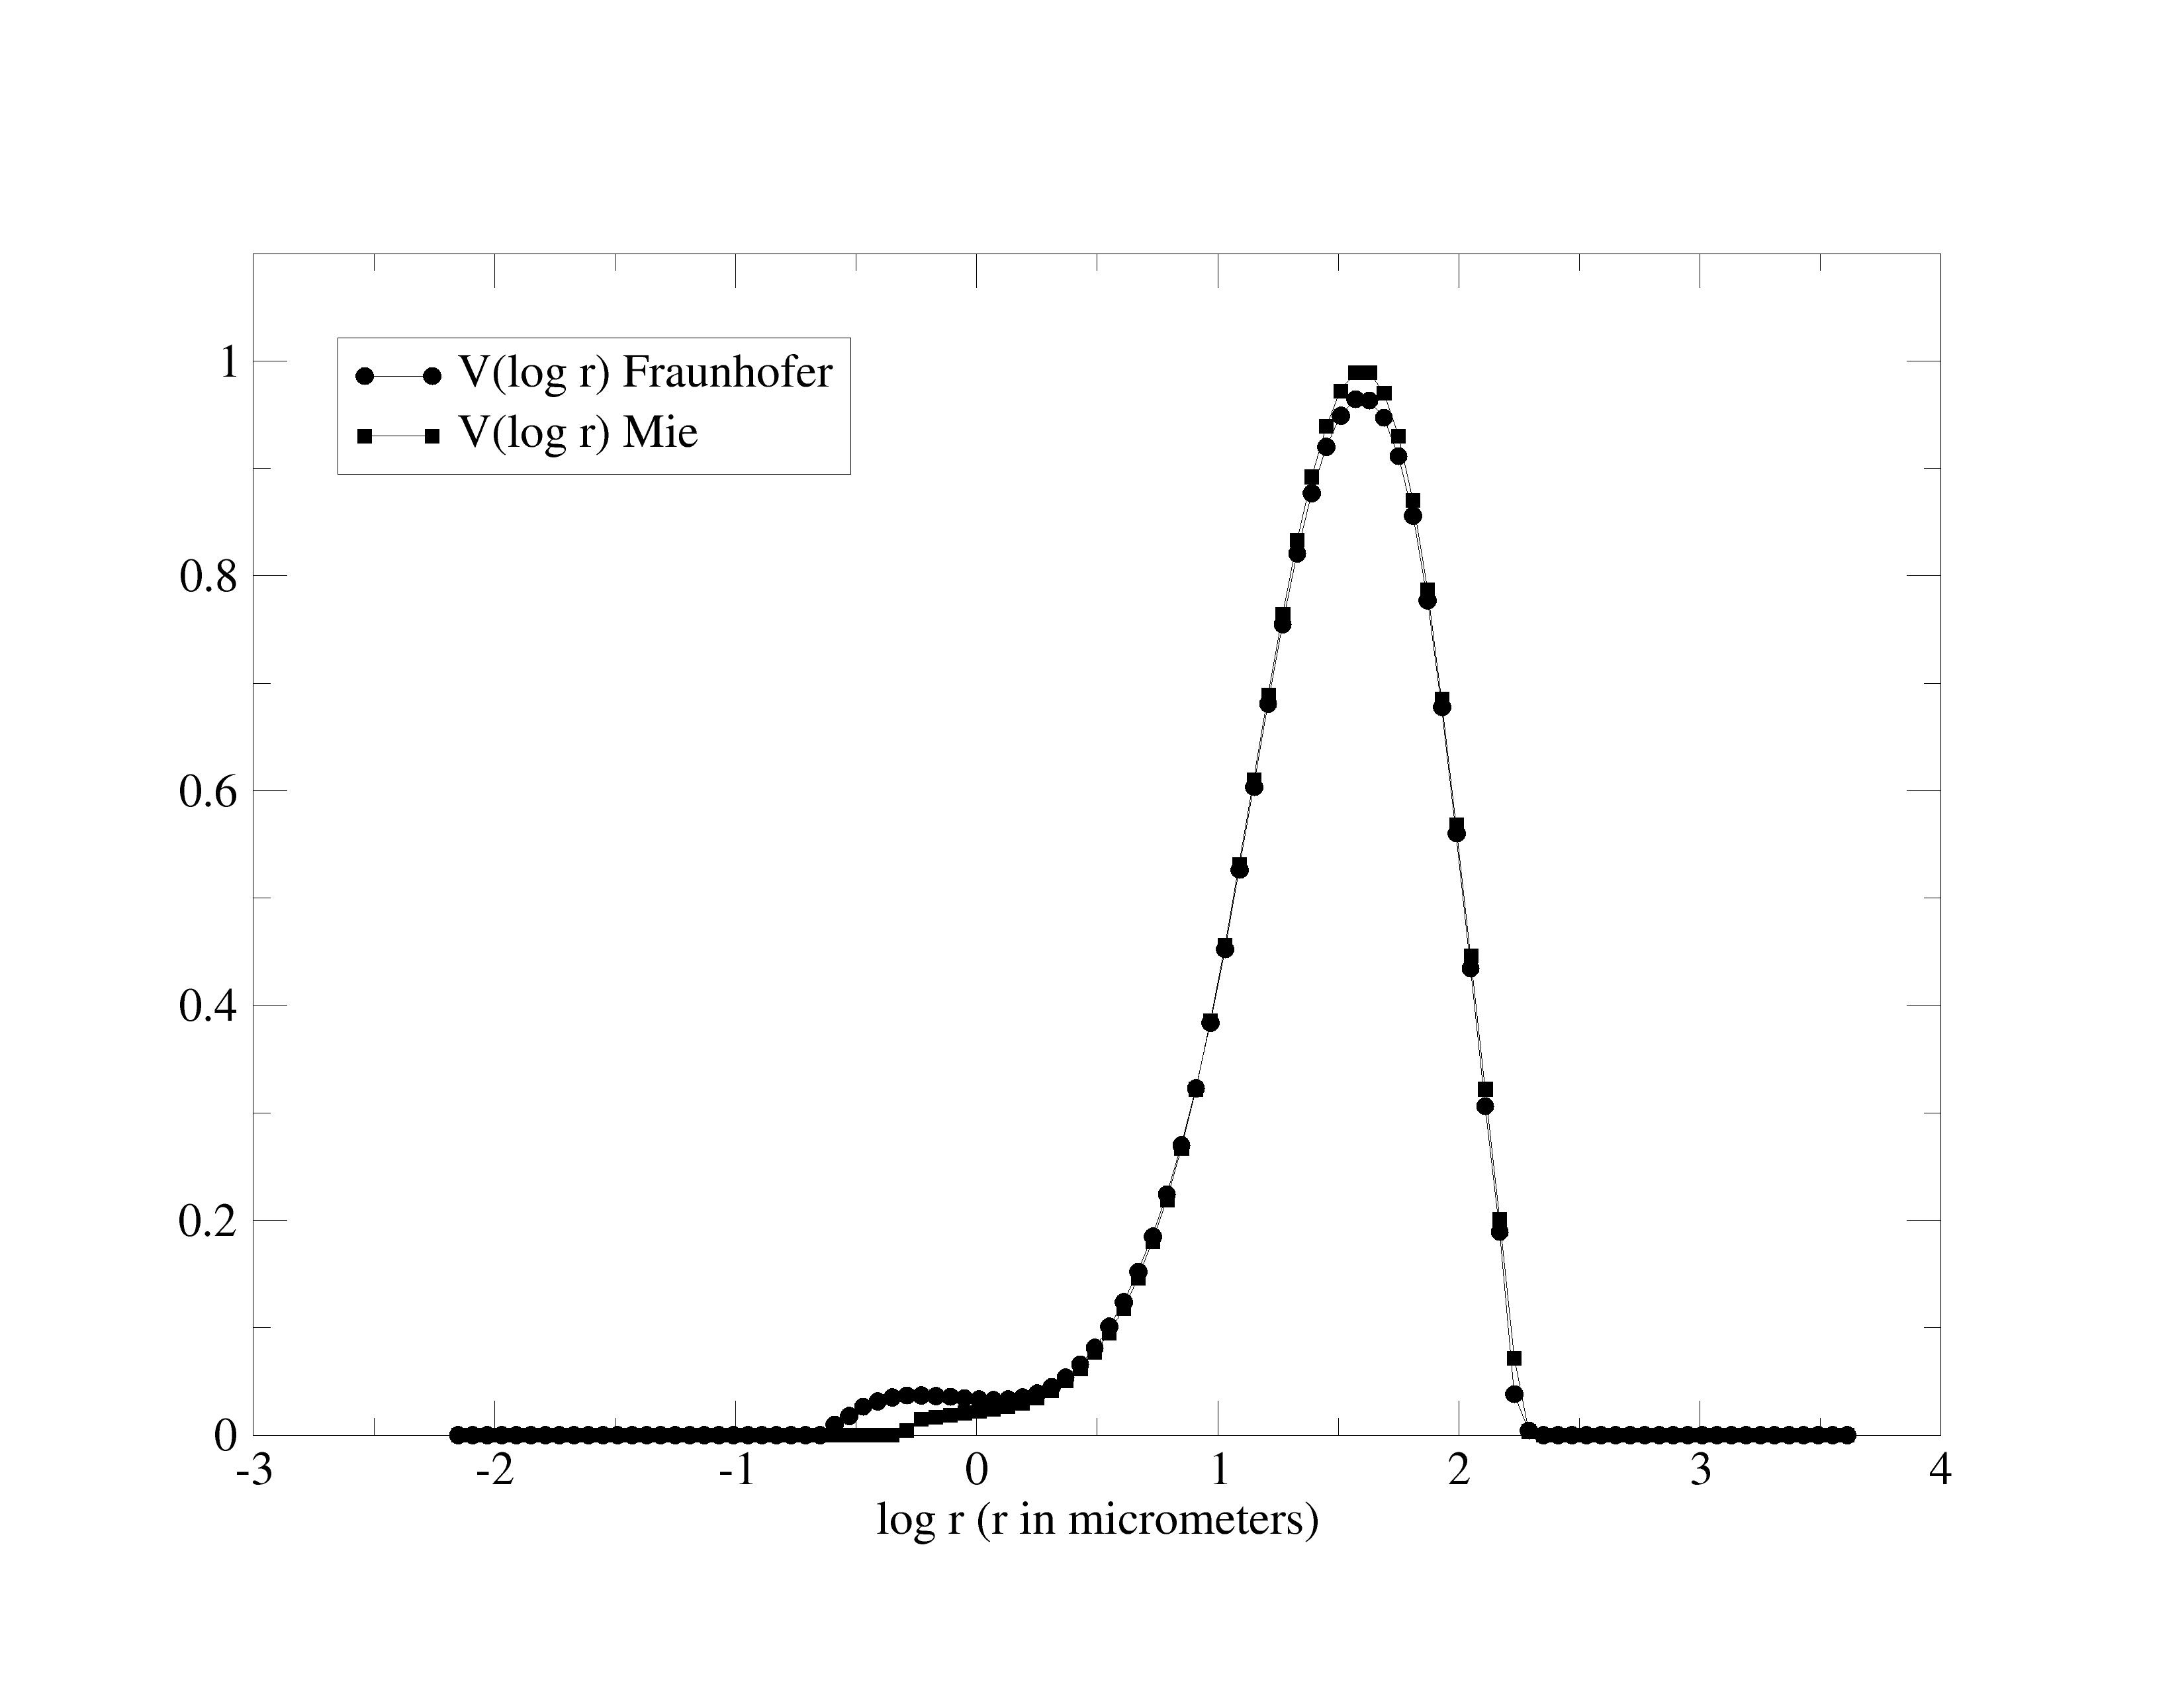
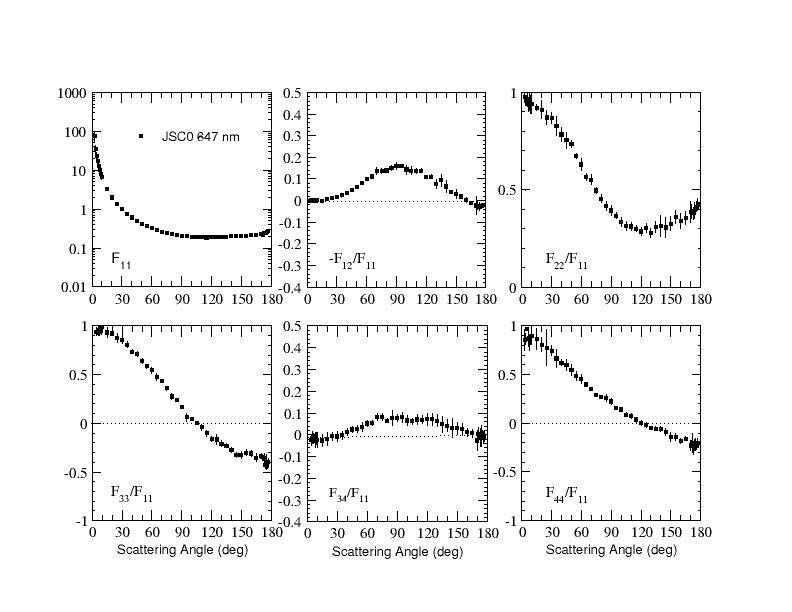
| JSC0 |
plot, table
|
View |
488 nm (plot, table)
647 nm (plot, table) |
488 nm (tableM, tableF)
647 nm (tableM, tableF) |
Dabrowska et al. 2015
|
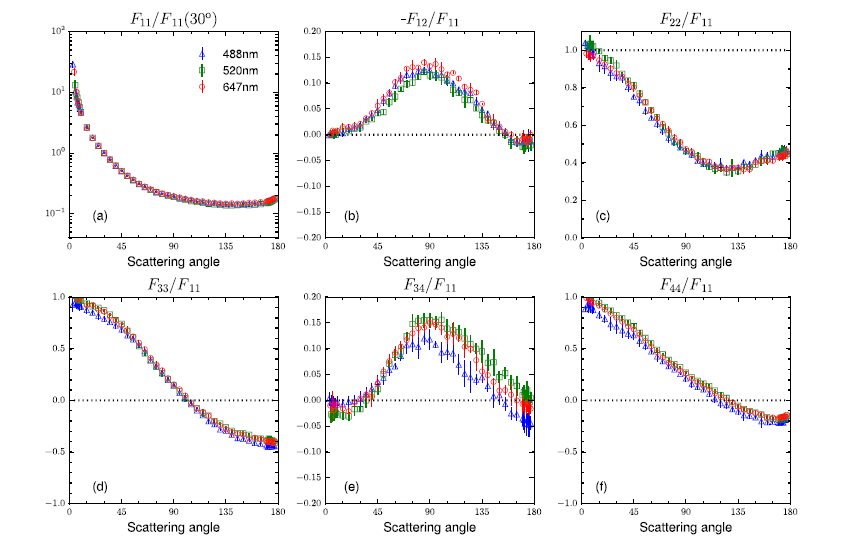
| JSC-1A |
plot, table
|
View |
488 nm (plot, table)
520 nm (plot, table)
647 nm (plot, table)
|
488 nm (tableM, tableF)
520 nm (tableM, tableF)
647 nm (tableM, tableF) |
Escobar-Cerezo et al. 2018
|
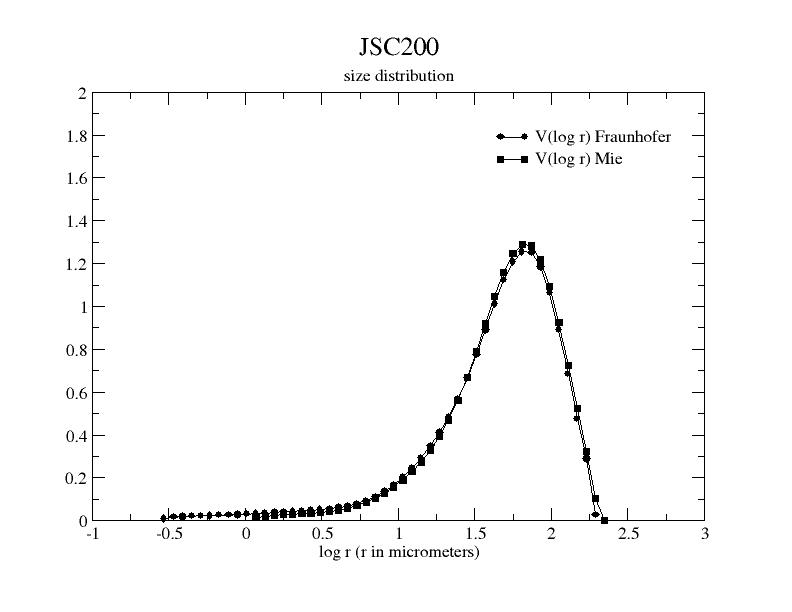
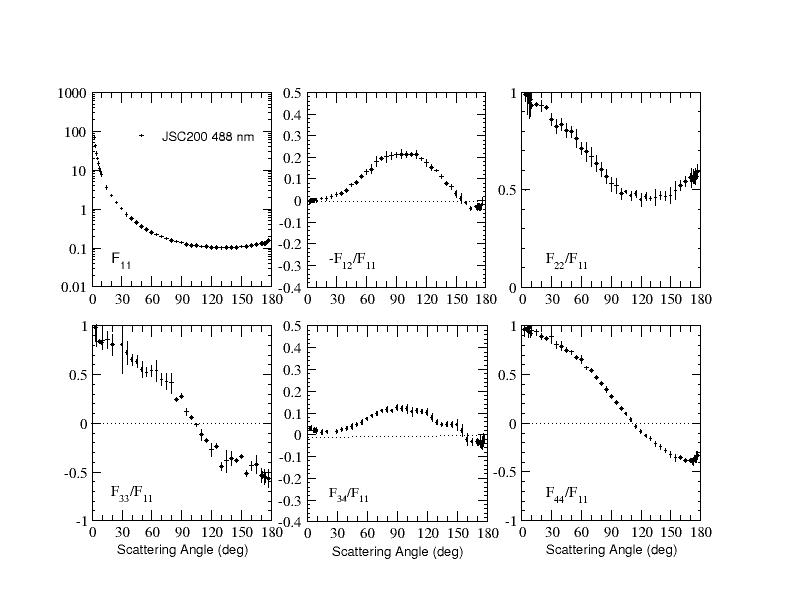
| JSC200 |
plot, table
|
View |
488 nm (plot, table)
647 nm (plot, table) |
488 nm (tableM, tableF)
647 nm (tableM, tableF) |
Dabrowska et al. 2015
|
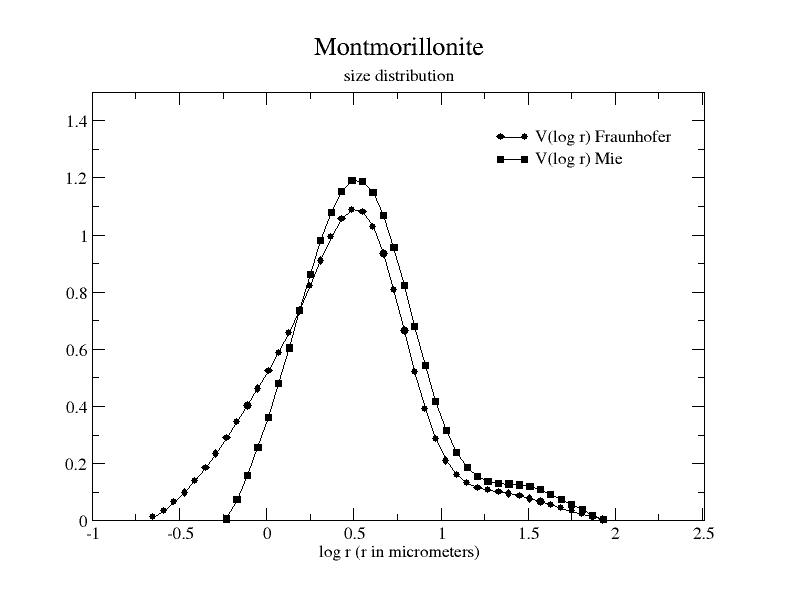
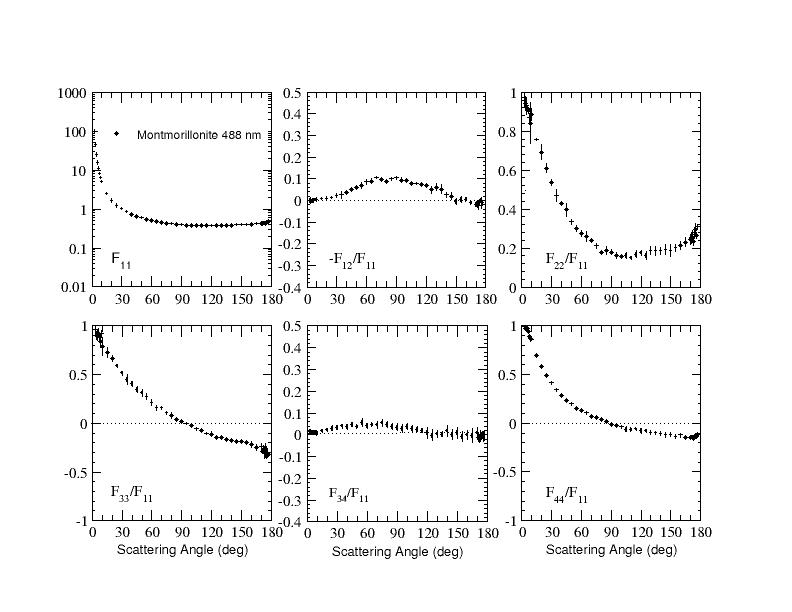
| Montmorillonite |
plot, table
|
View |
488 nm (plot, table)
|
488 nm (tableM, tableF) |
Dabrowska et al. 2015
|
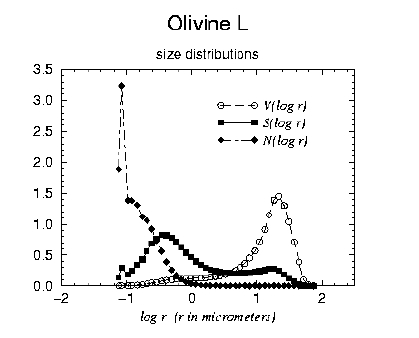
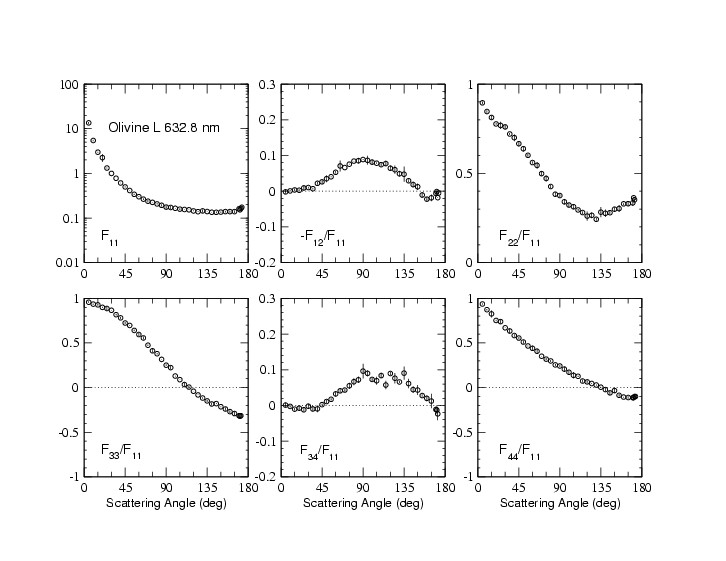
| Olivine L |
plot, table
|
View |
442 nm (plot, table)
633 nm (plot, table) |
|
Muñoz et al. 2000
|
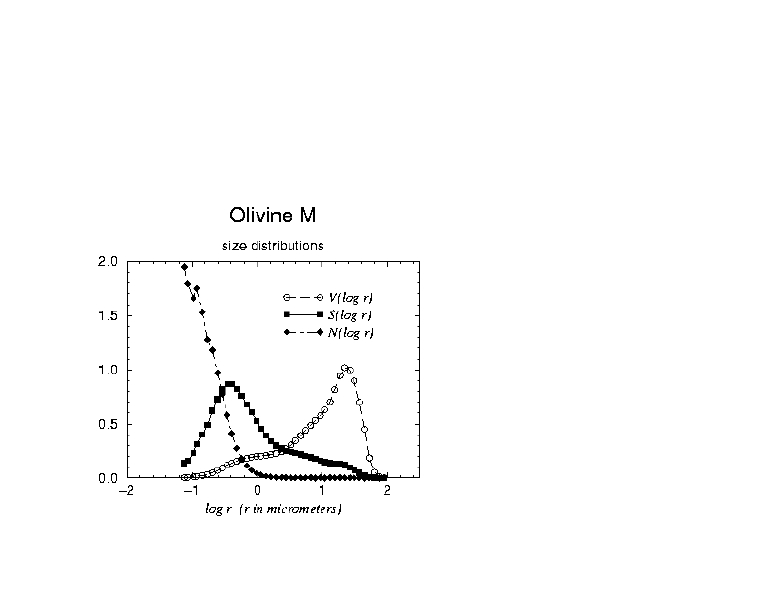
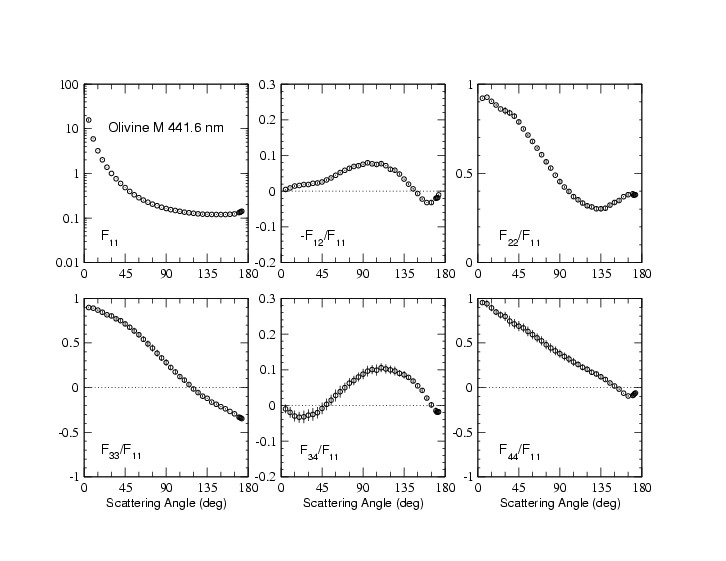
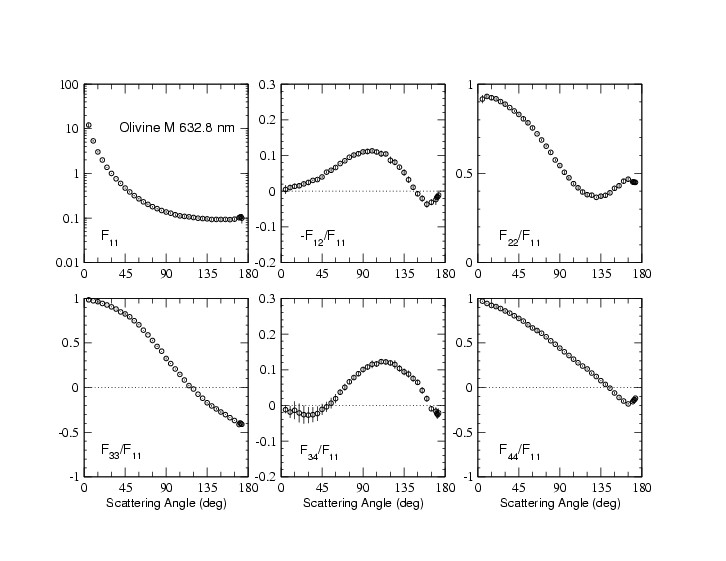
| Olivine M |
plot, table
|
View |
442 nm (plot, table)
633 nm (plot, table) |
|
Muñoz et al. 2000
|
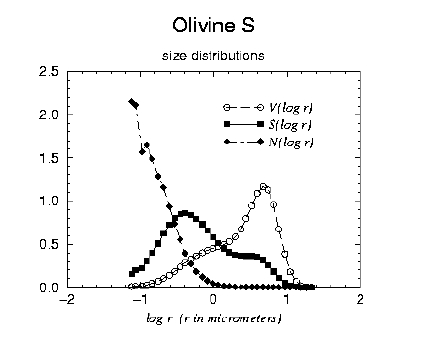
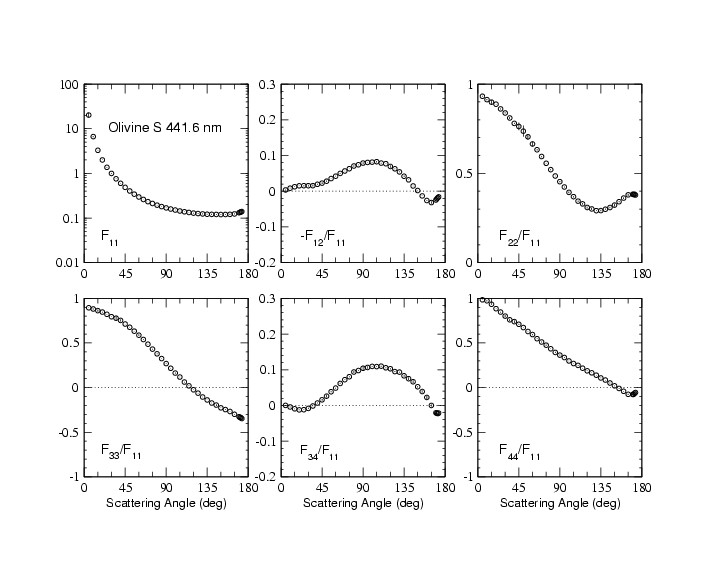
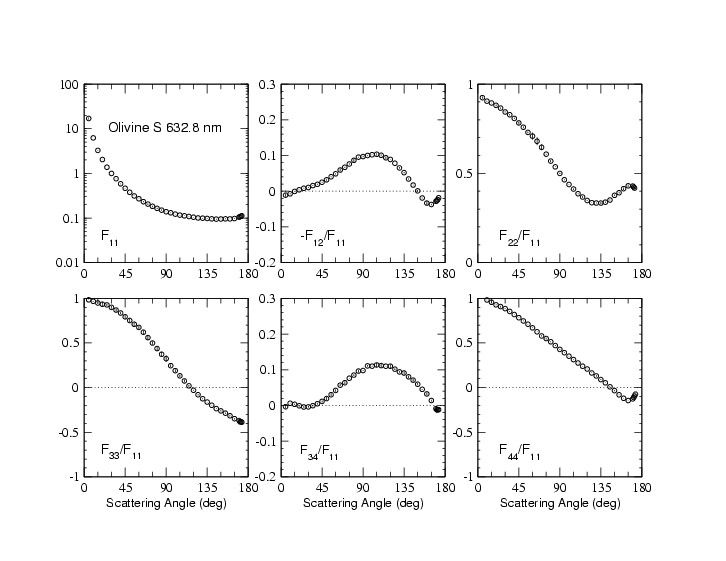
| Olivine S (Amsterdam) |
plot, table
|
View |
442 nm (plot, table)
633 nm (plot, table) |
|
Muñoz et al. 2000
|
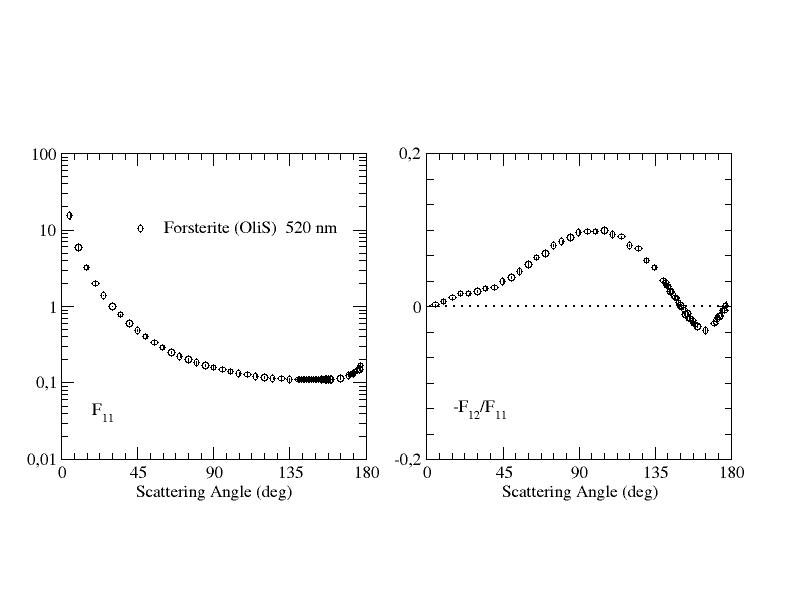
| Olivine S / Forsterite (Granada) |
plot, table
|
View |
520 nm (plot, table) |
520 nm (tableM, tableF) |
Fratin et al. 2019
|
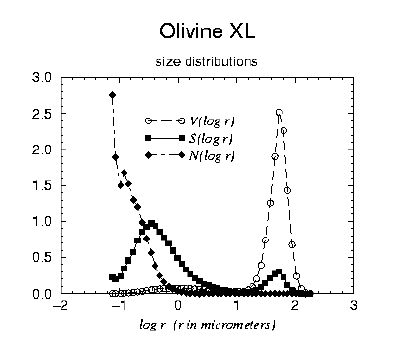
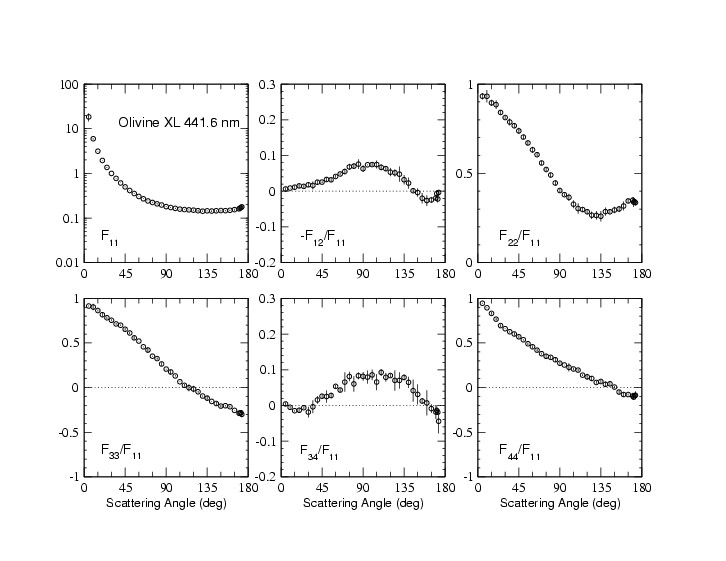
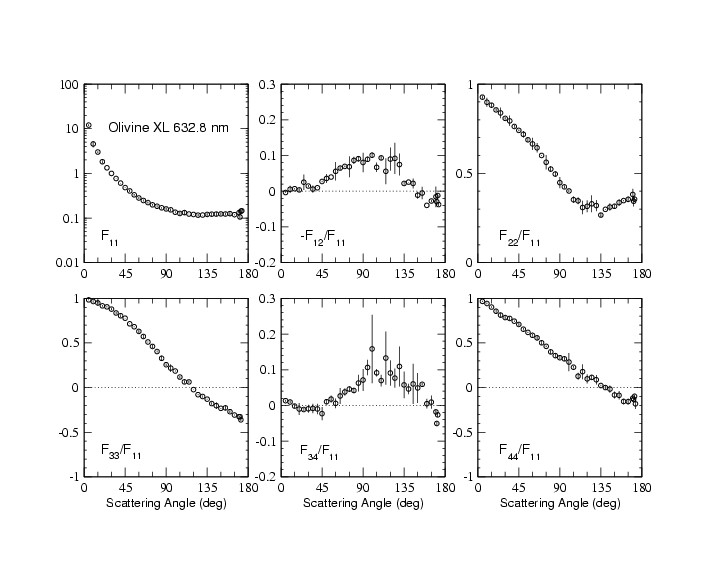
| Olivine XL |
plot, table
|
View |
442 nm (plot, table)
633 nm (plot, table) |
|
Muñoz et al. 2000
|
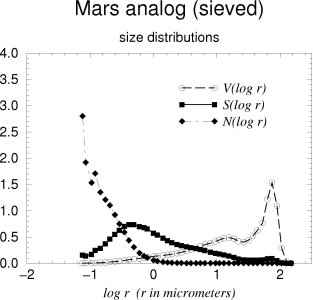
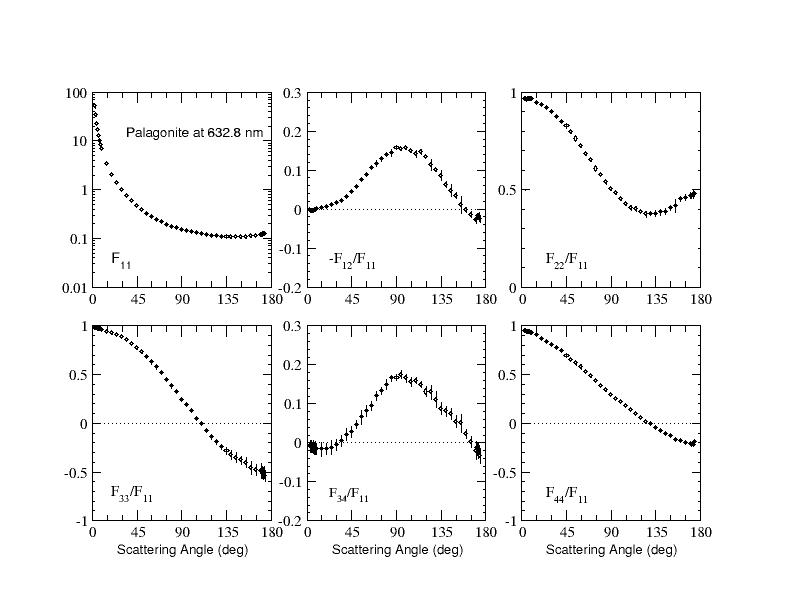
| Palagonite |
plot, table
|
View |
632.8 nm (plot, table) |
632.8 nm (tableF) |
Laan et al. 2009
|
| Tholins |
|
View |
647 nm (plot, table) |
|
Fratin et al. 2019
|
