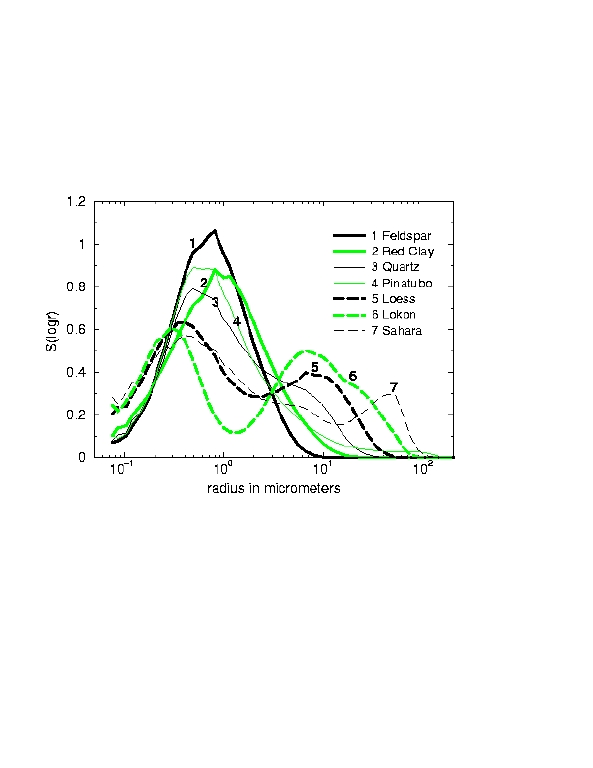
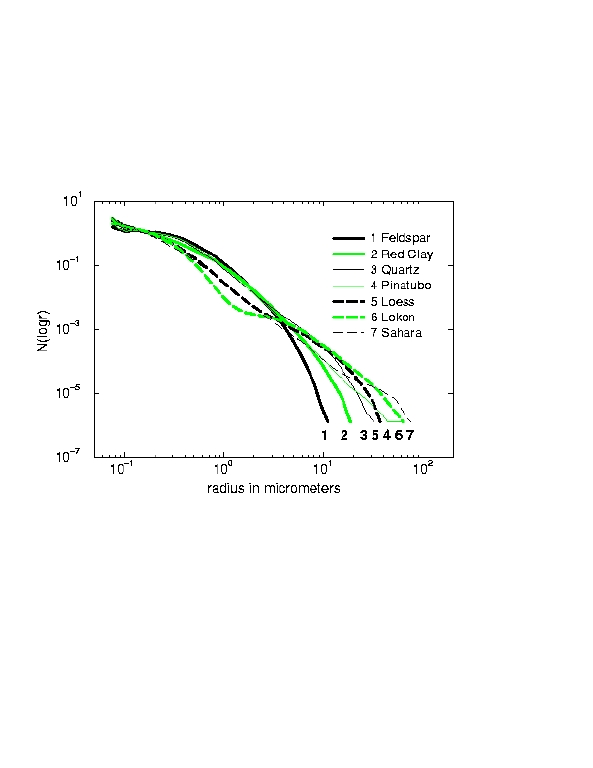
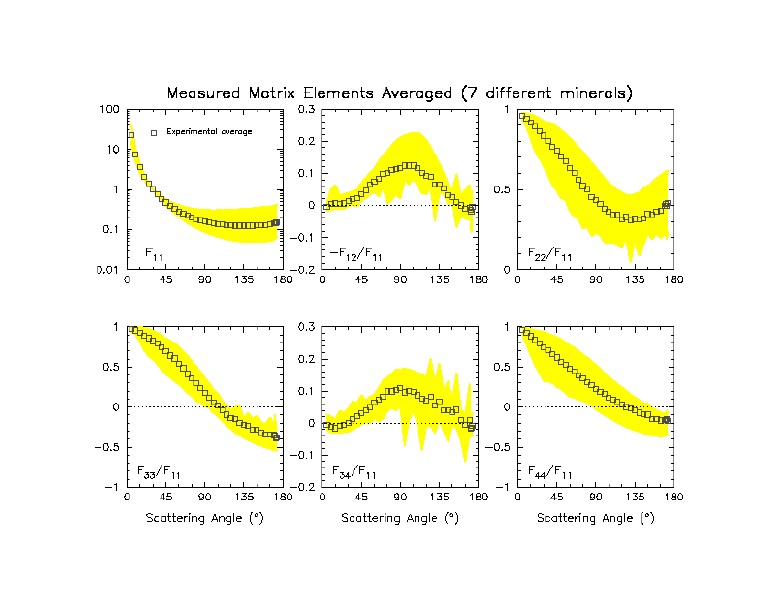
| Average Aerosol |
S(logr), N(logr) |
|
|
441.6 nm and 632.8 nm combined (plot, table) |
|
Volten et al. 2001
|
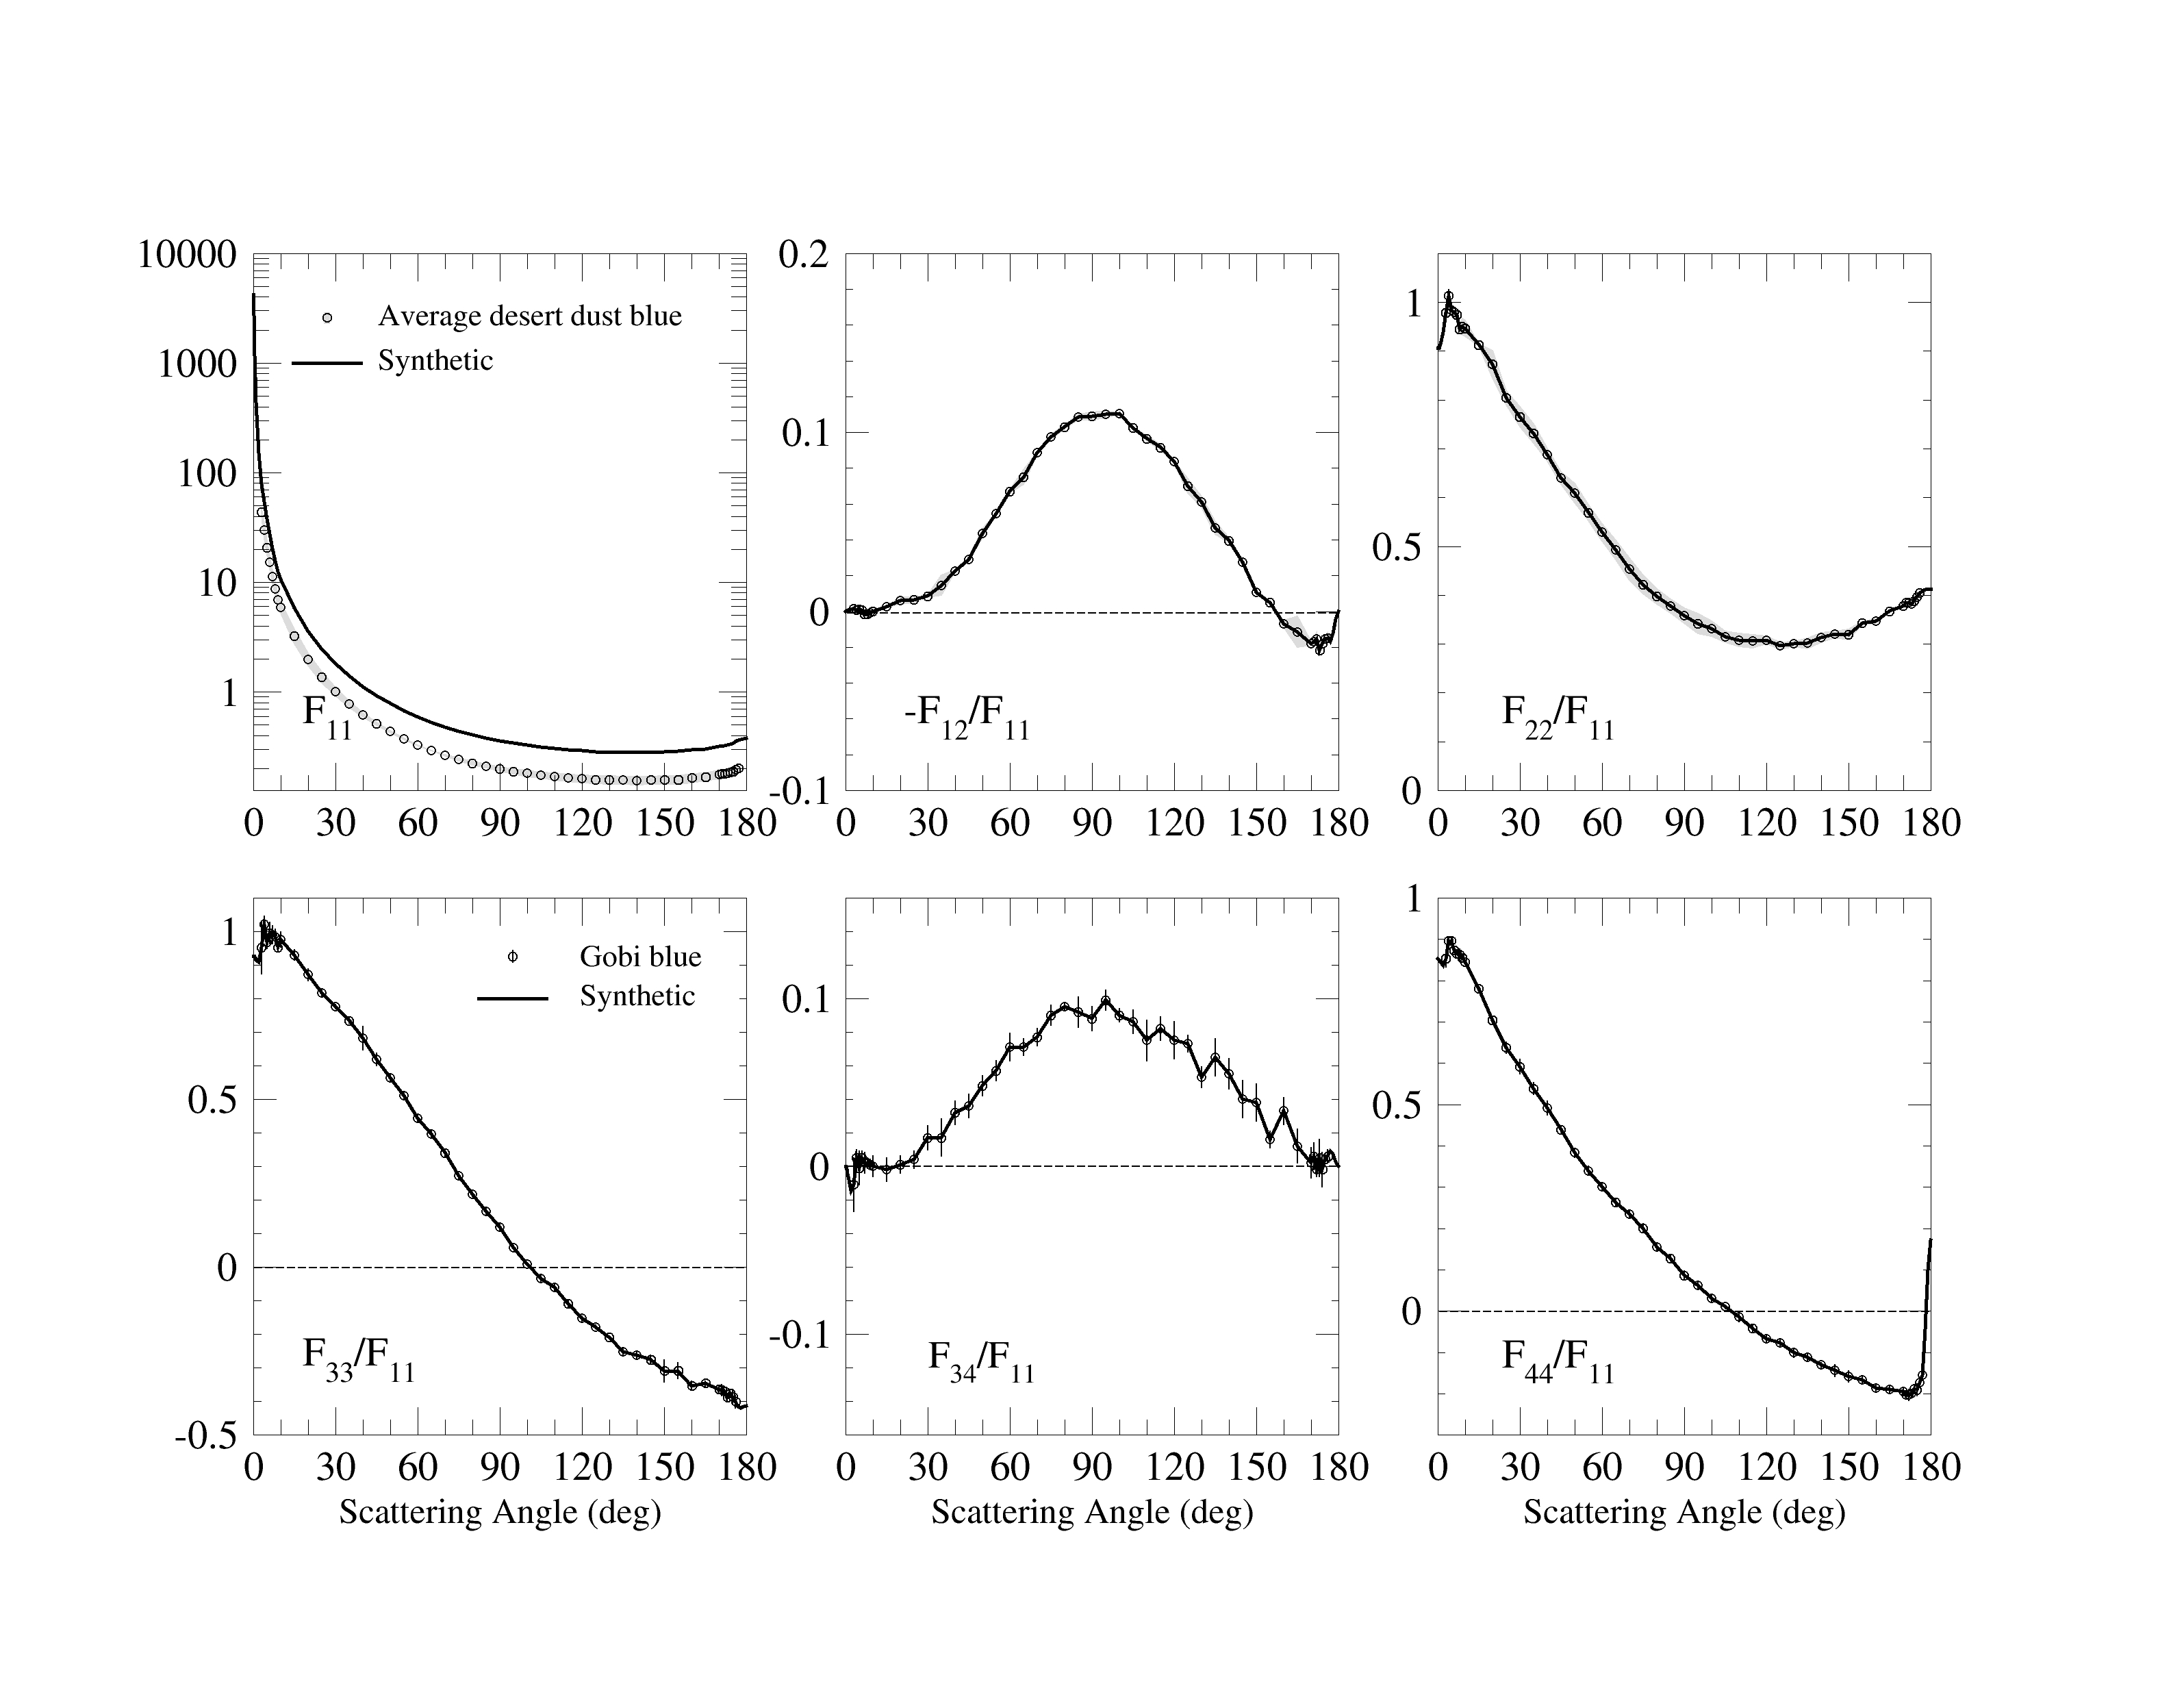
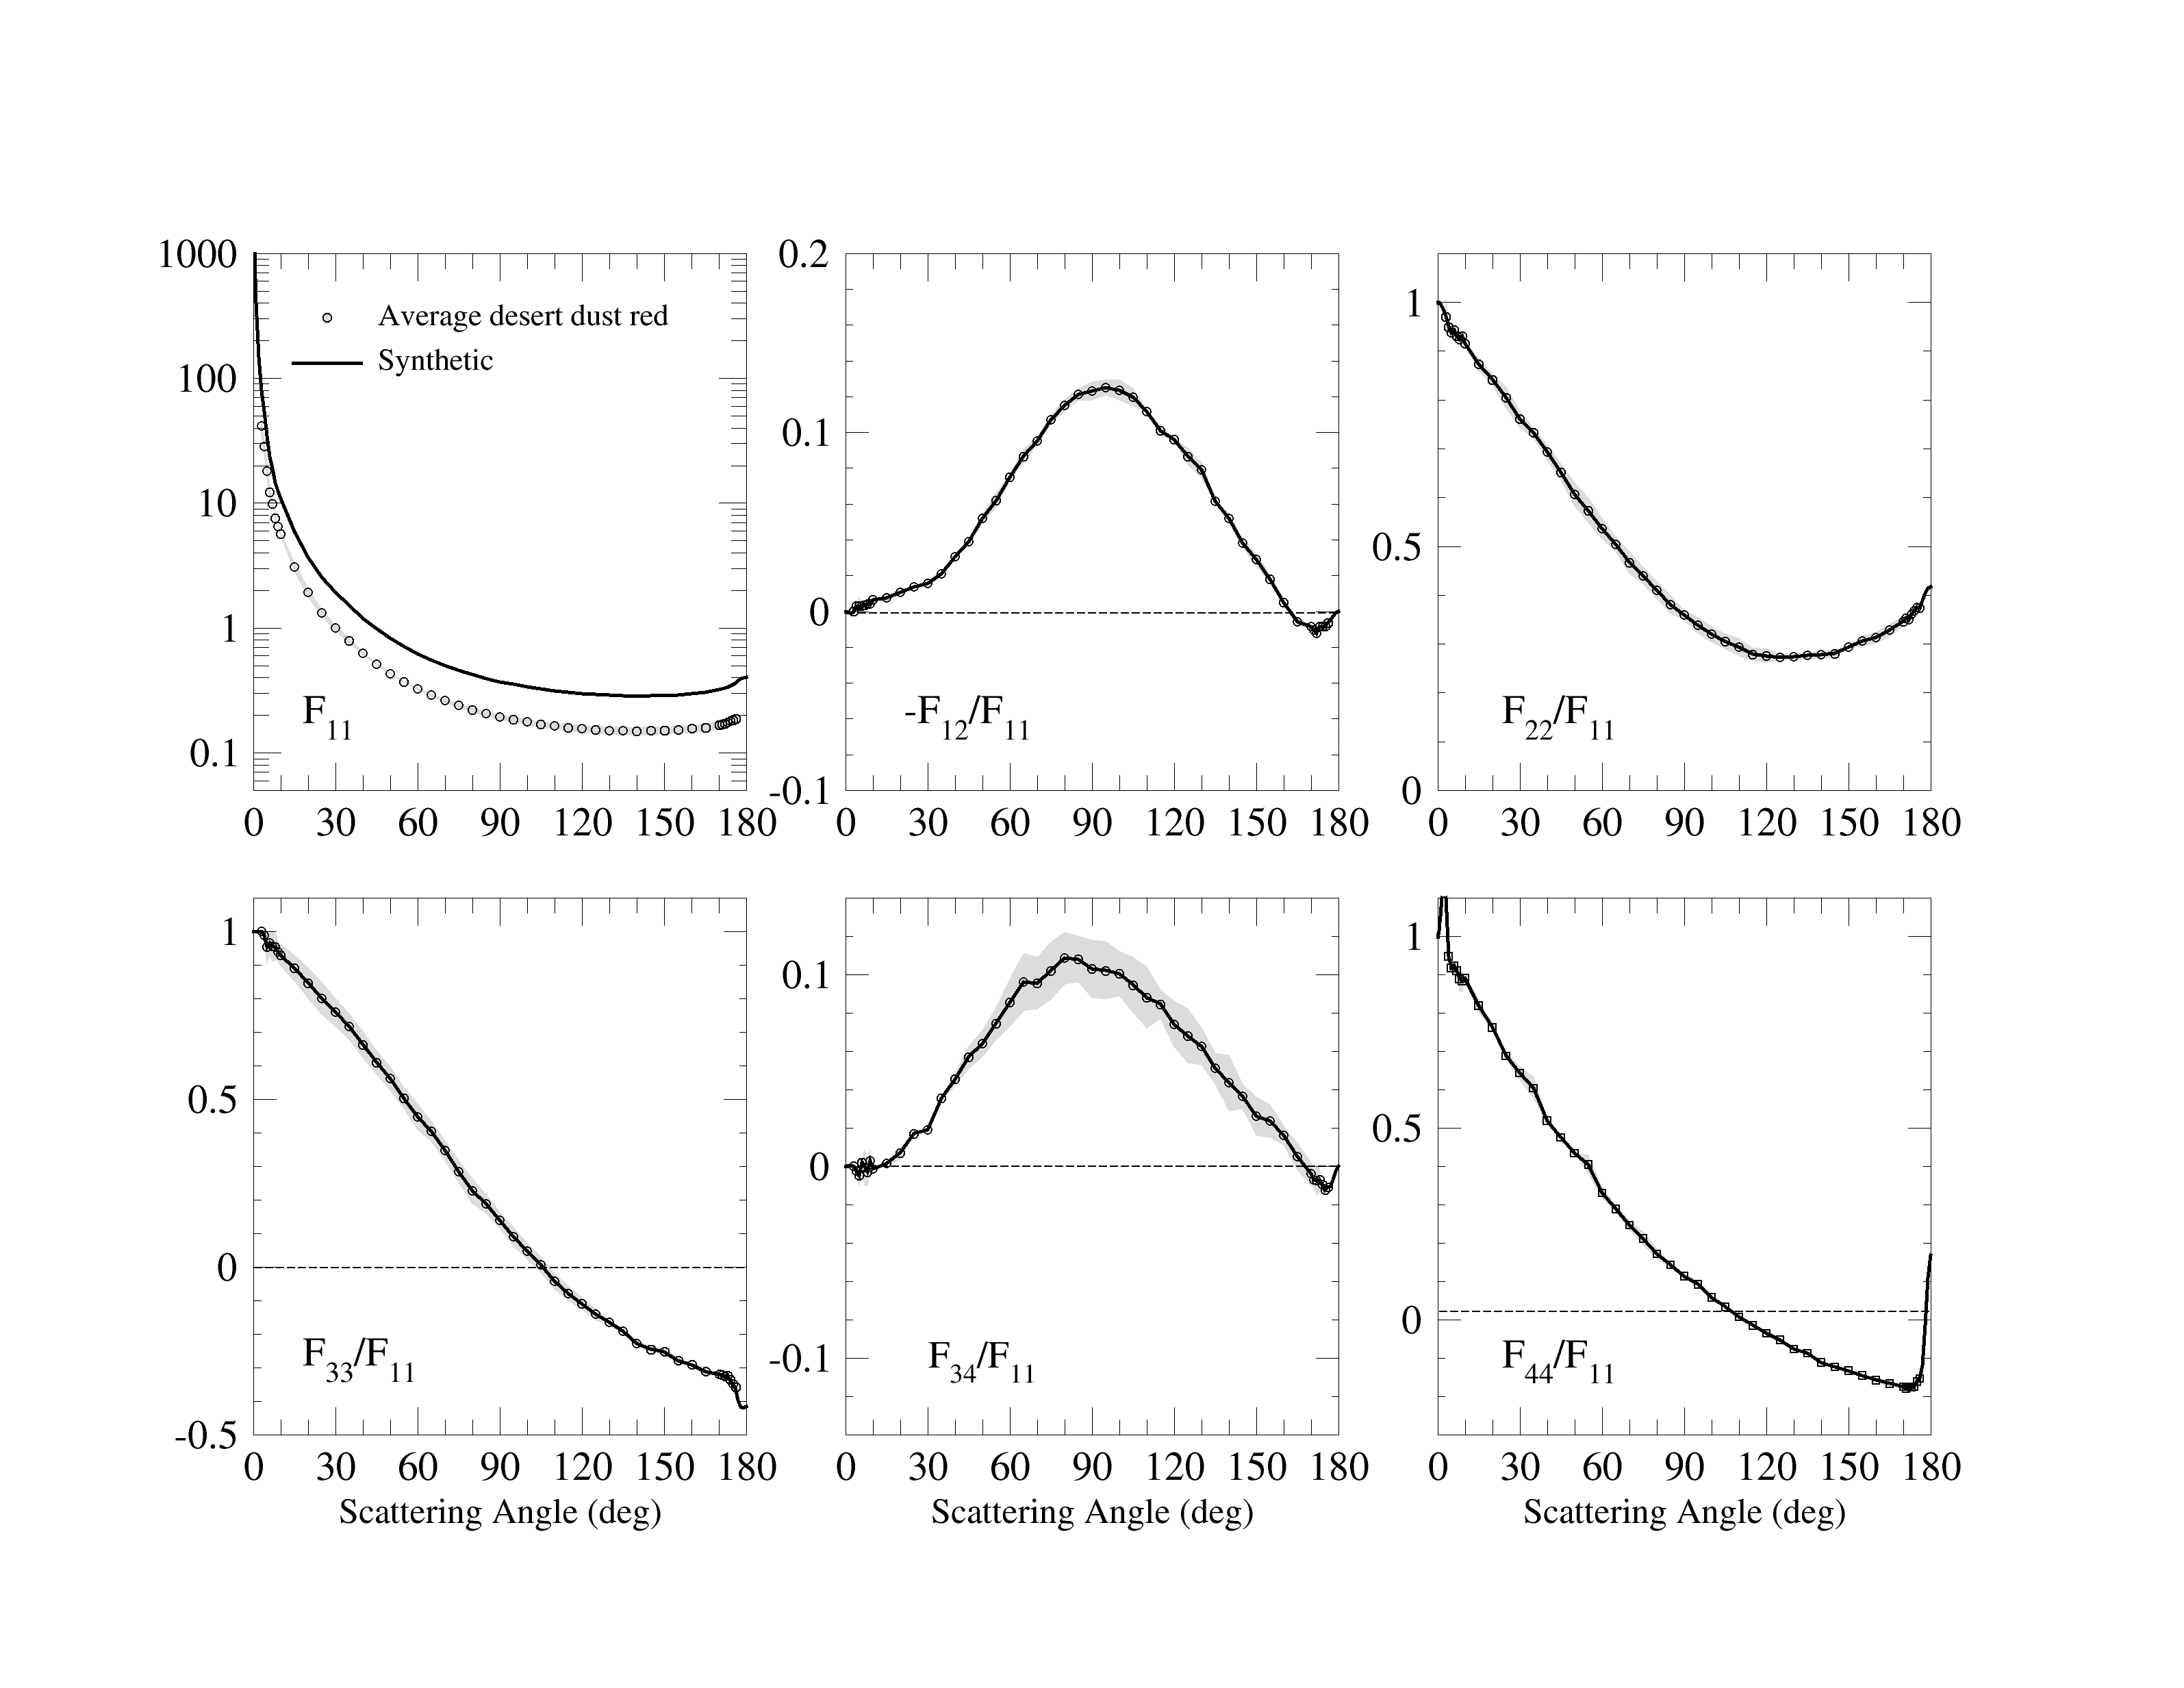
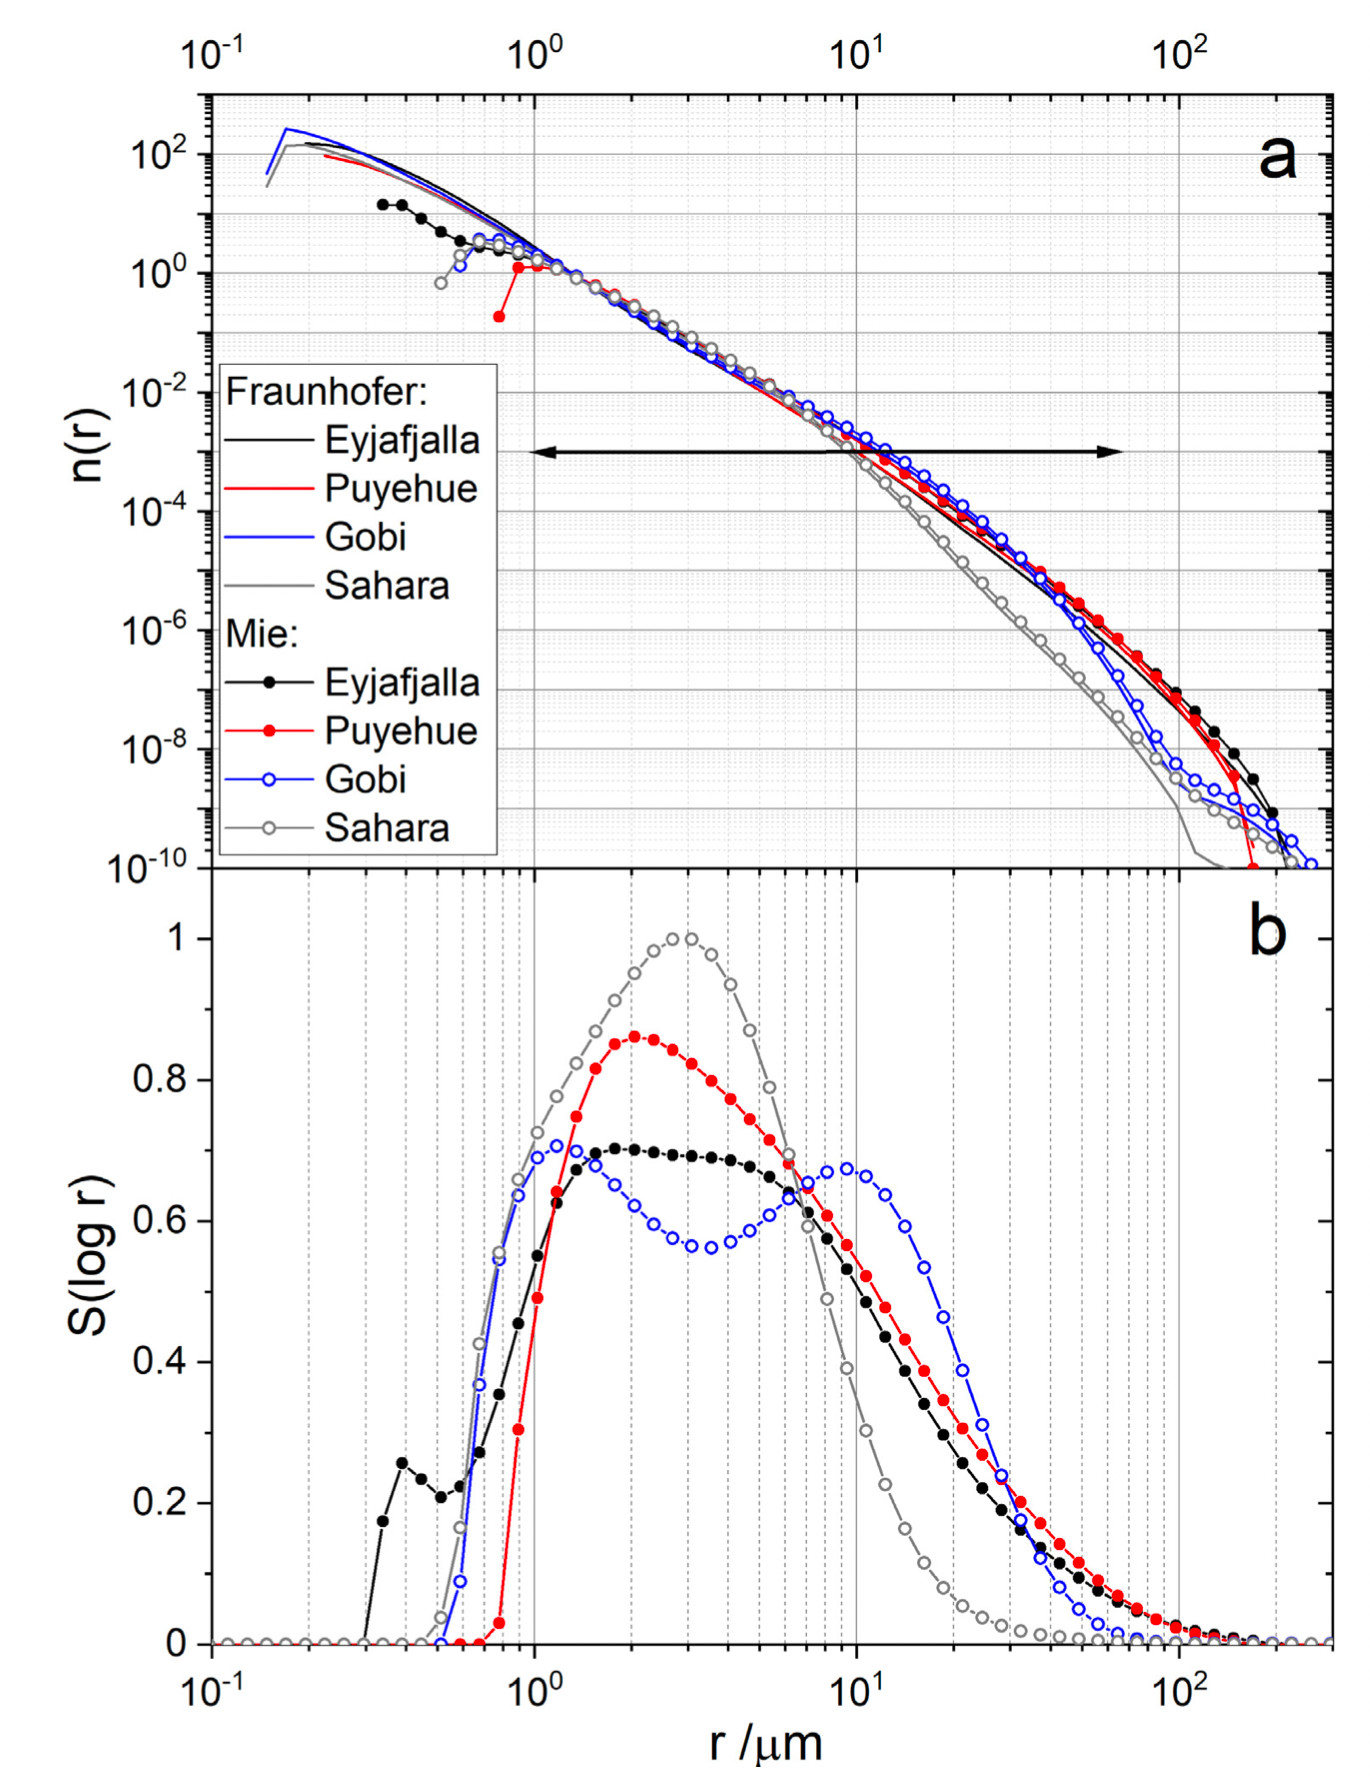
| Average Desert Dust |
|
|
|
488 nm (plot, table)
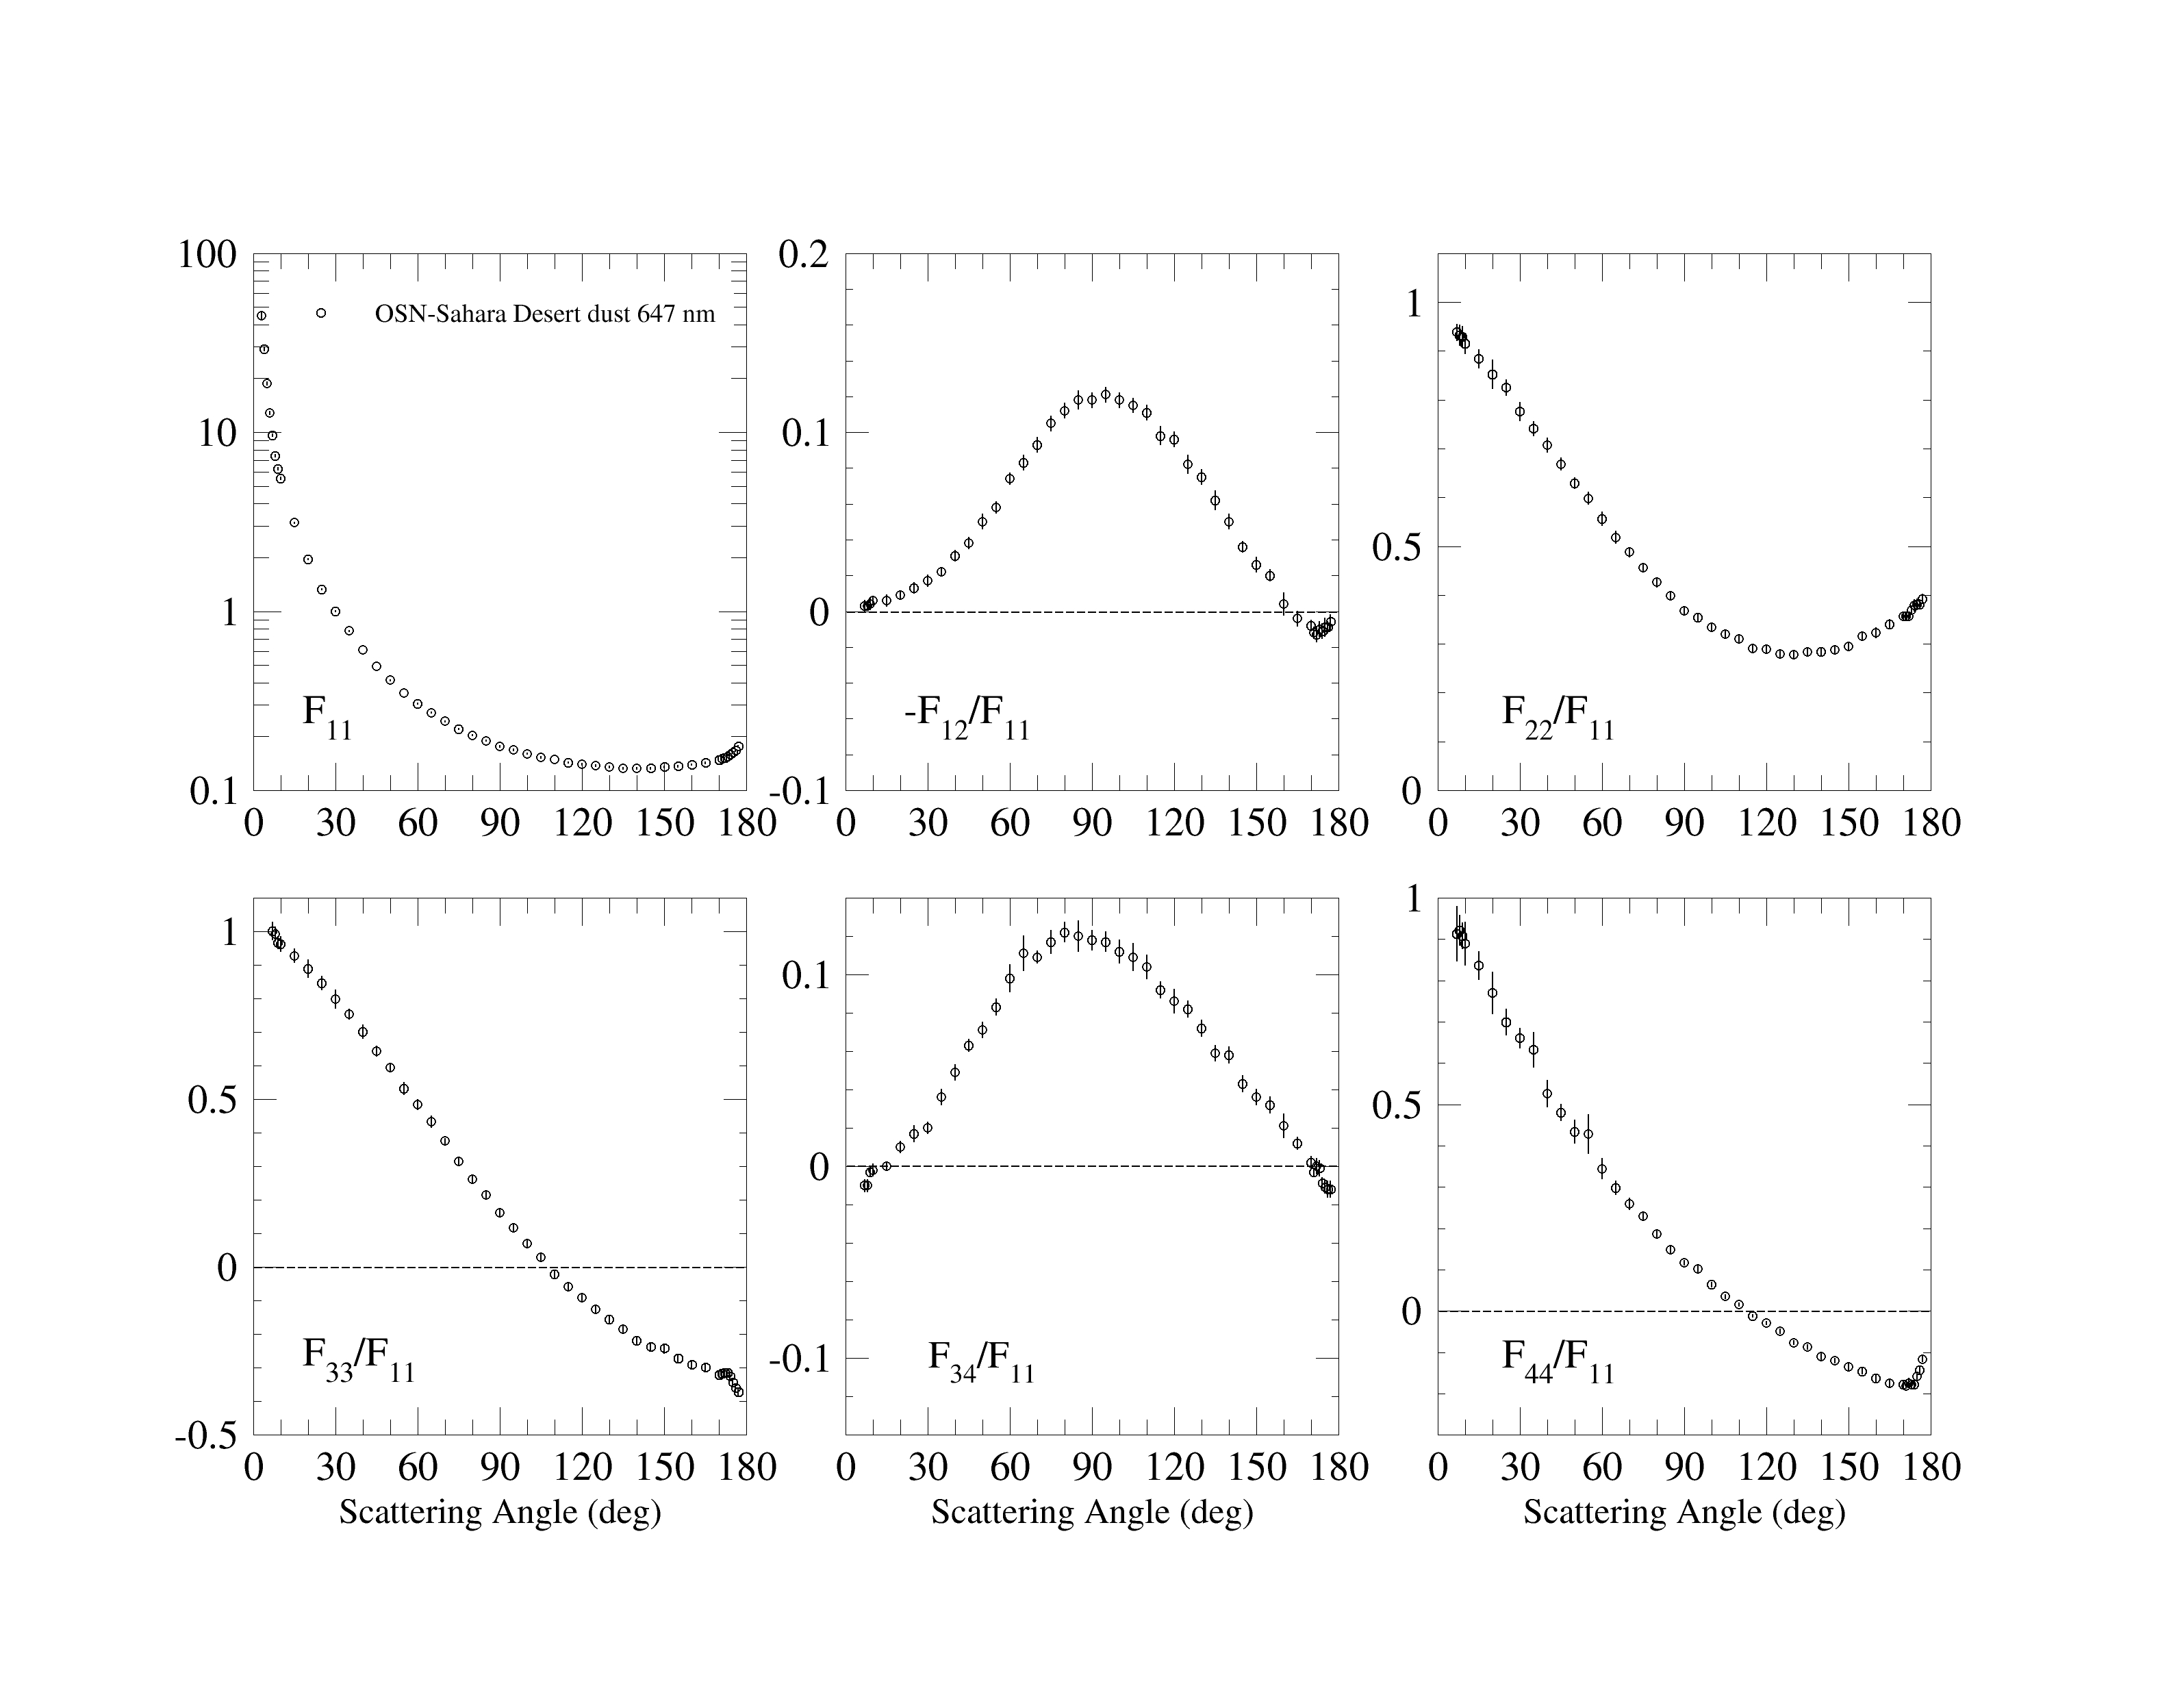
647 nm (plot, table) |
488 nm (tableM)
647 nm (tableM) |
Gómez Martín et al. 2021
|
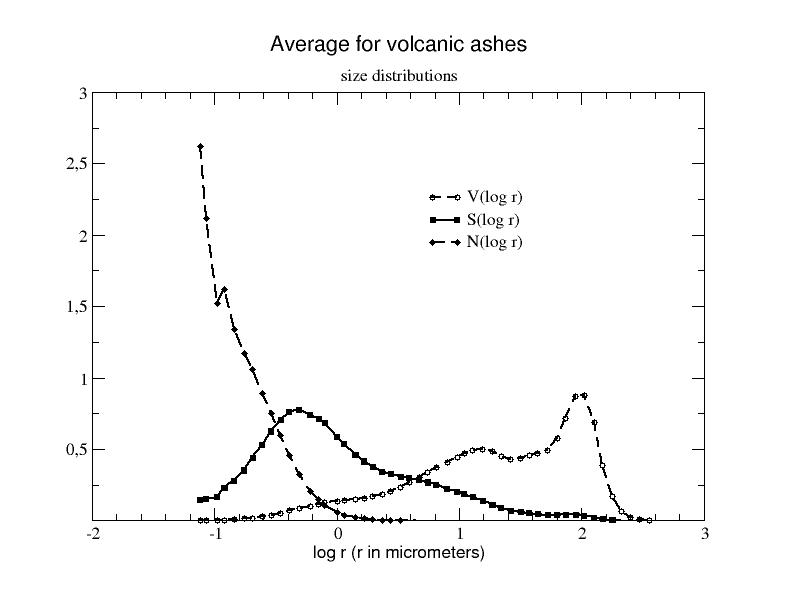
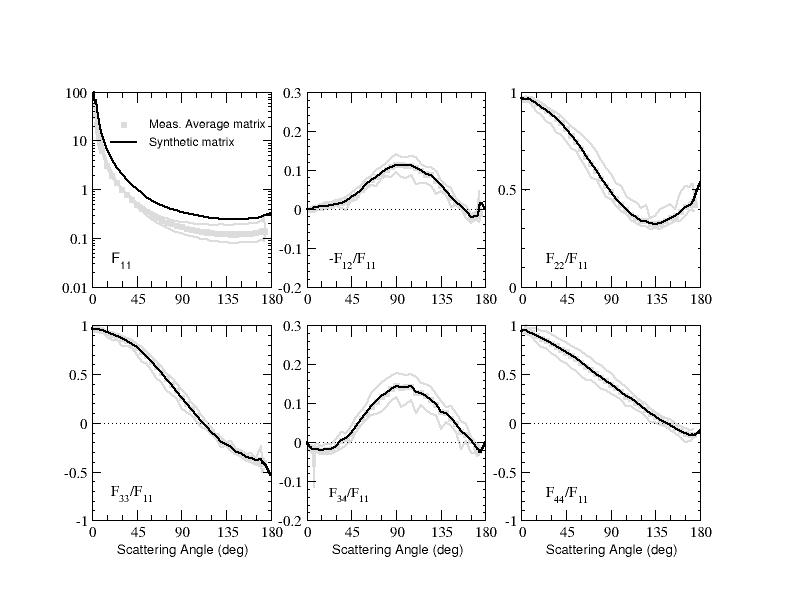
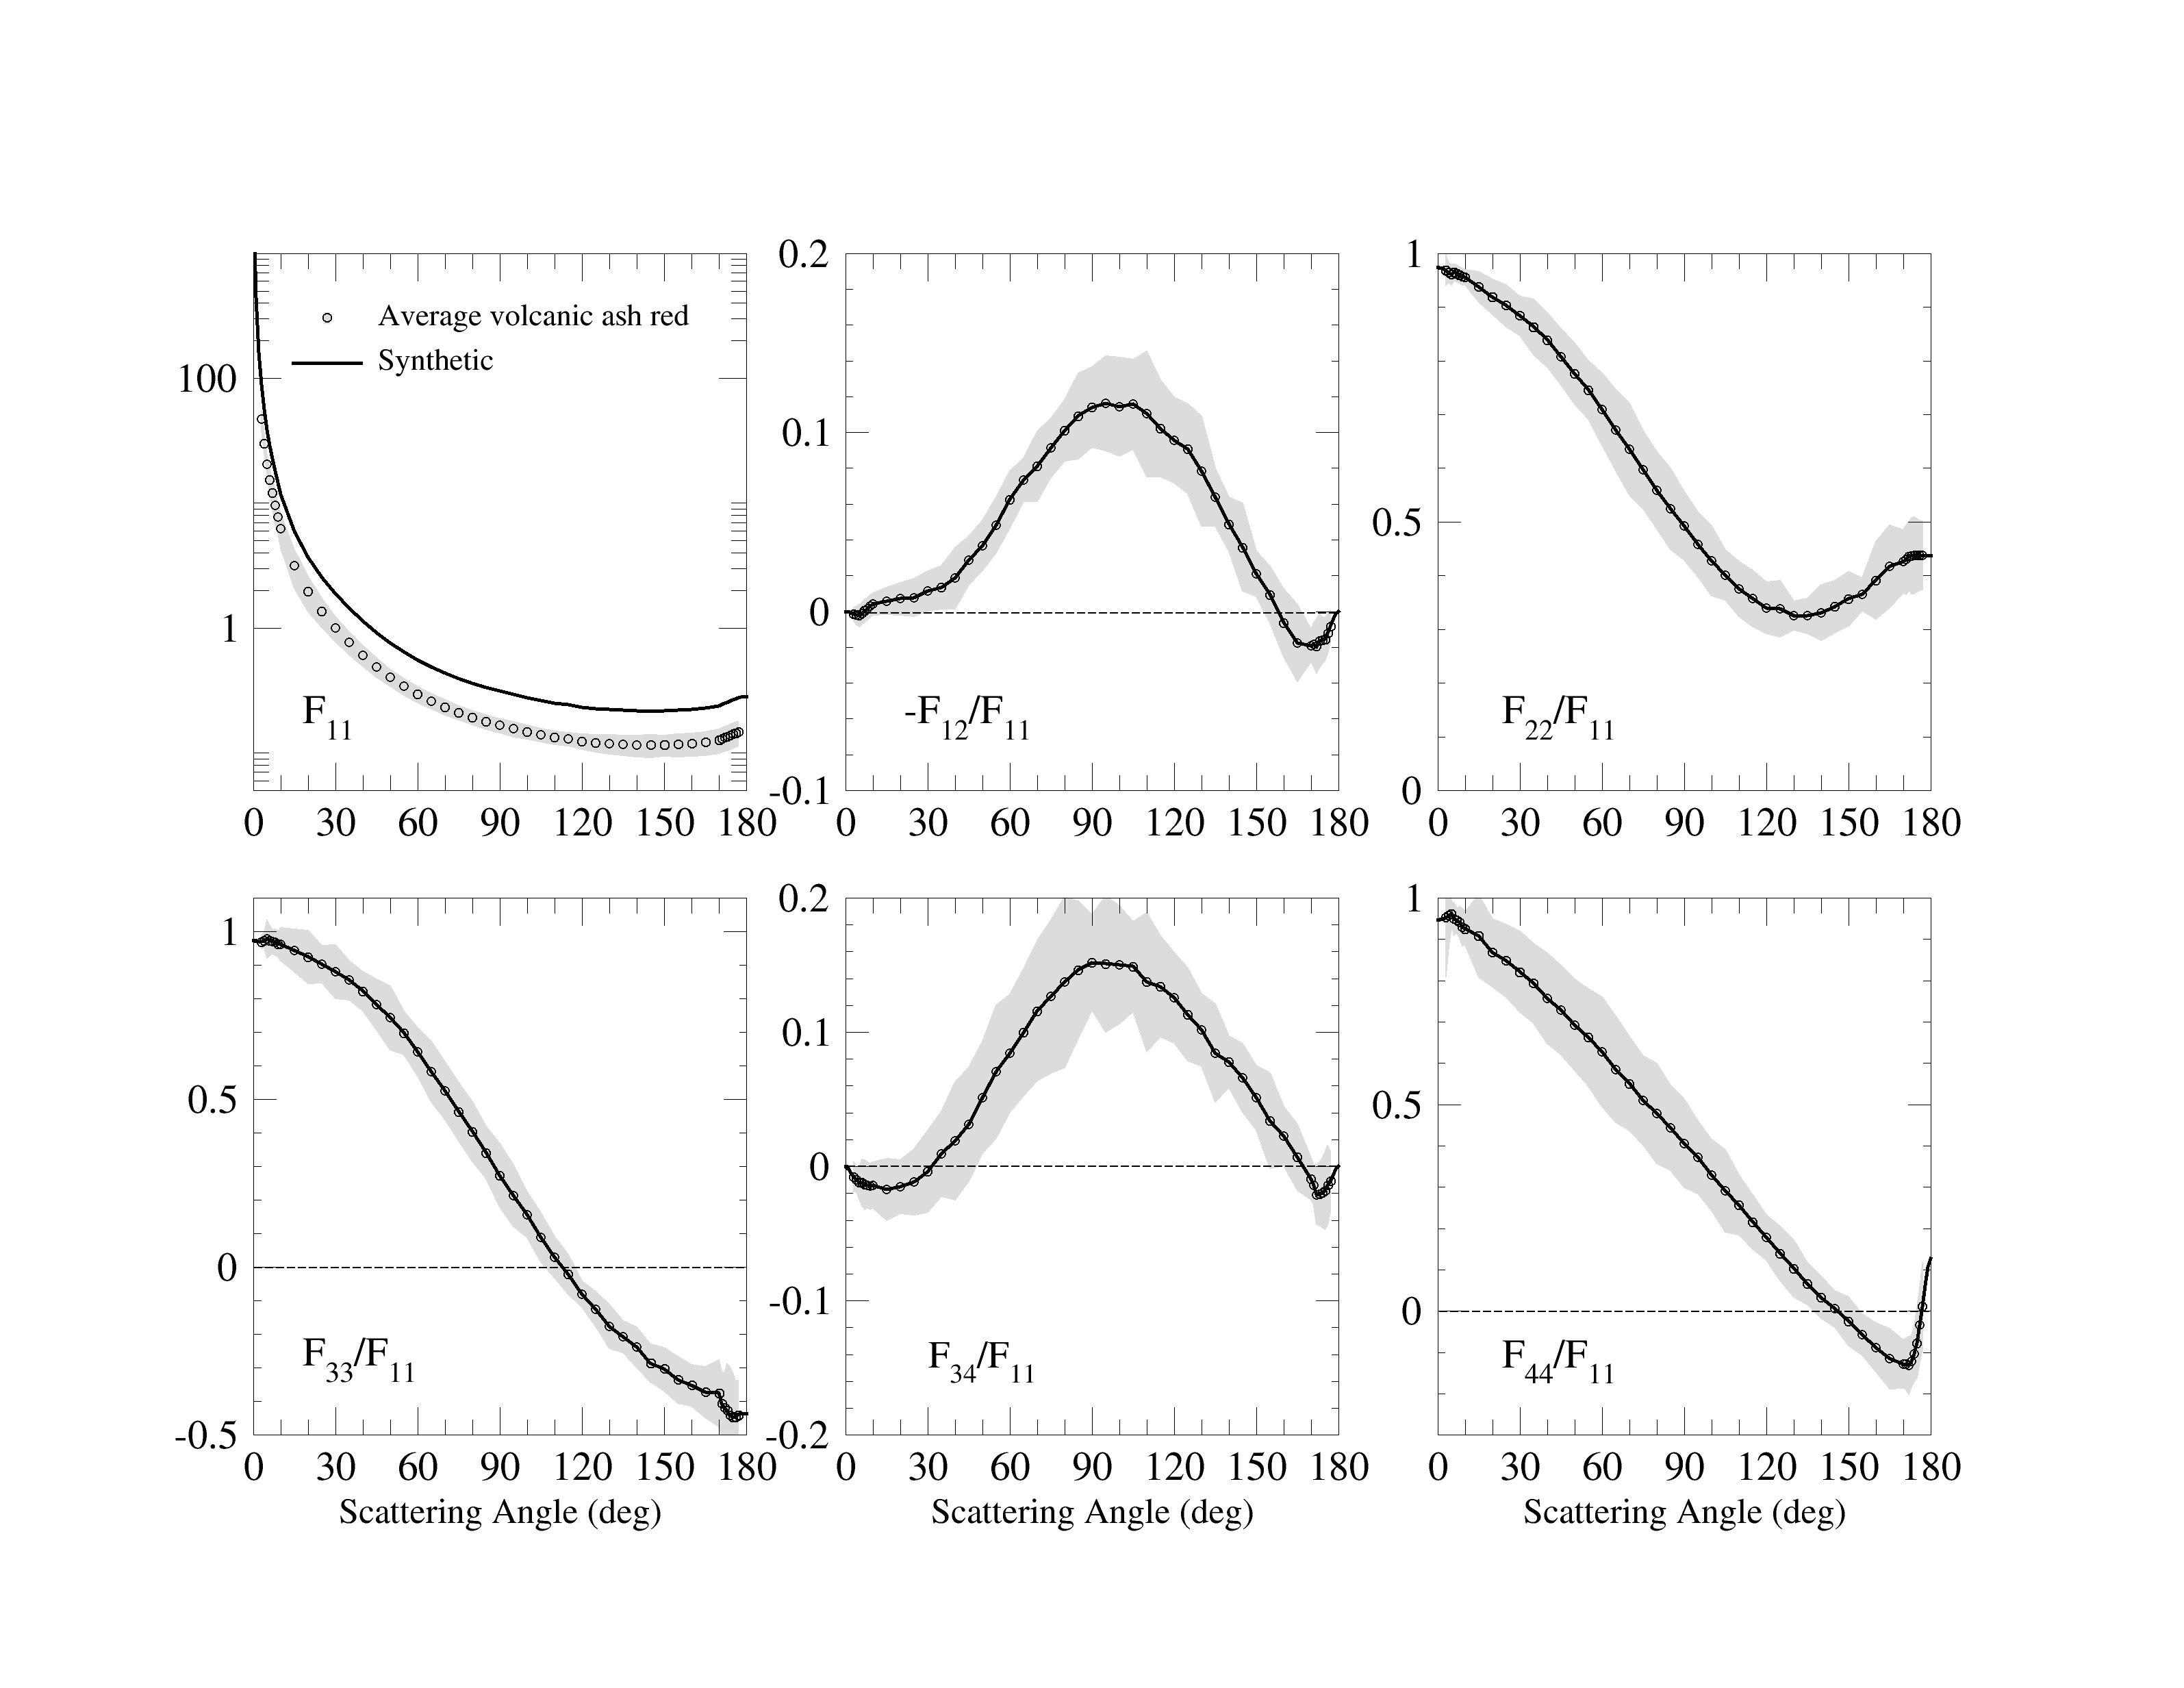
| Average Volcanic Ash (Amsterdam) |
plot, table |
|
|
|
632.8 nm(plot, table) |
Muñoz et al. 2004
Muñoz et al. 2002
Volten et al. 2001
|
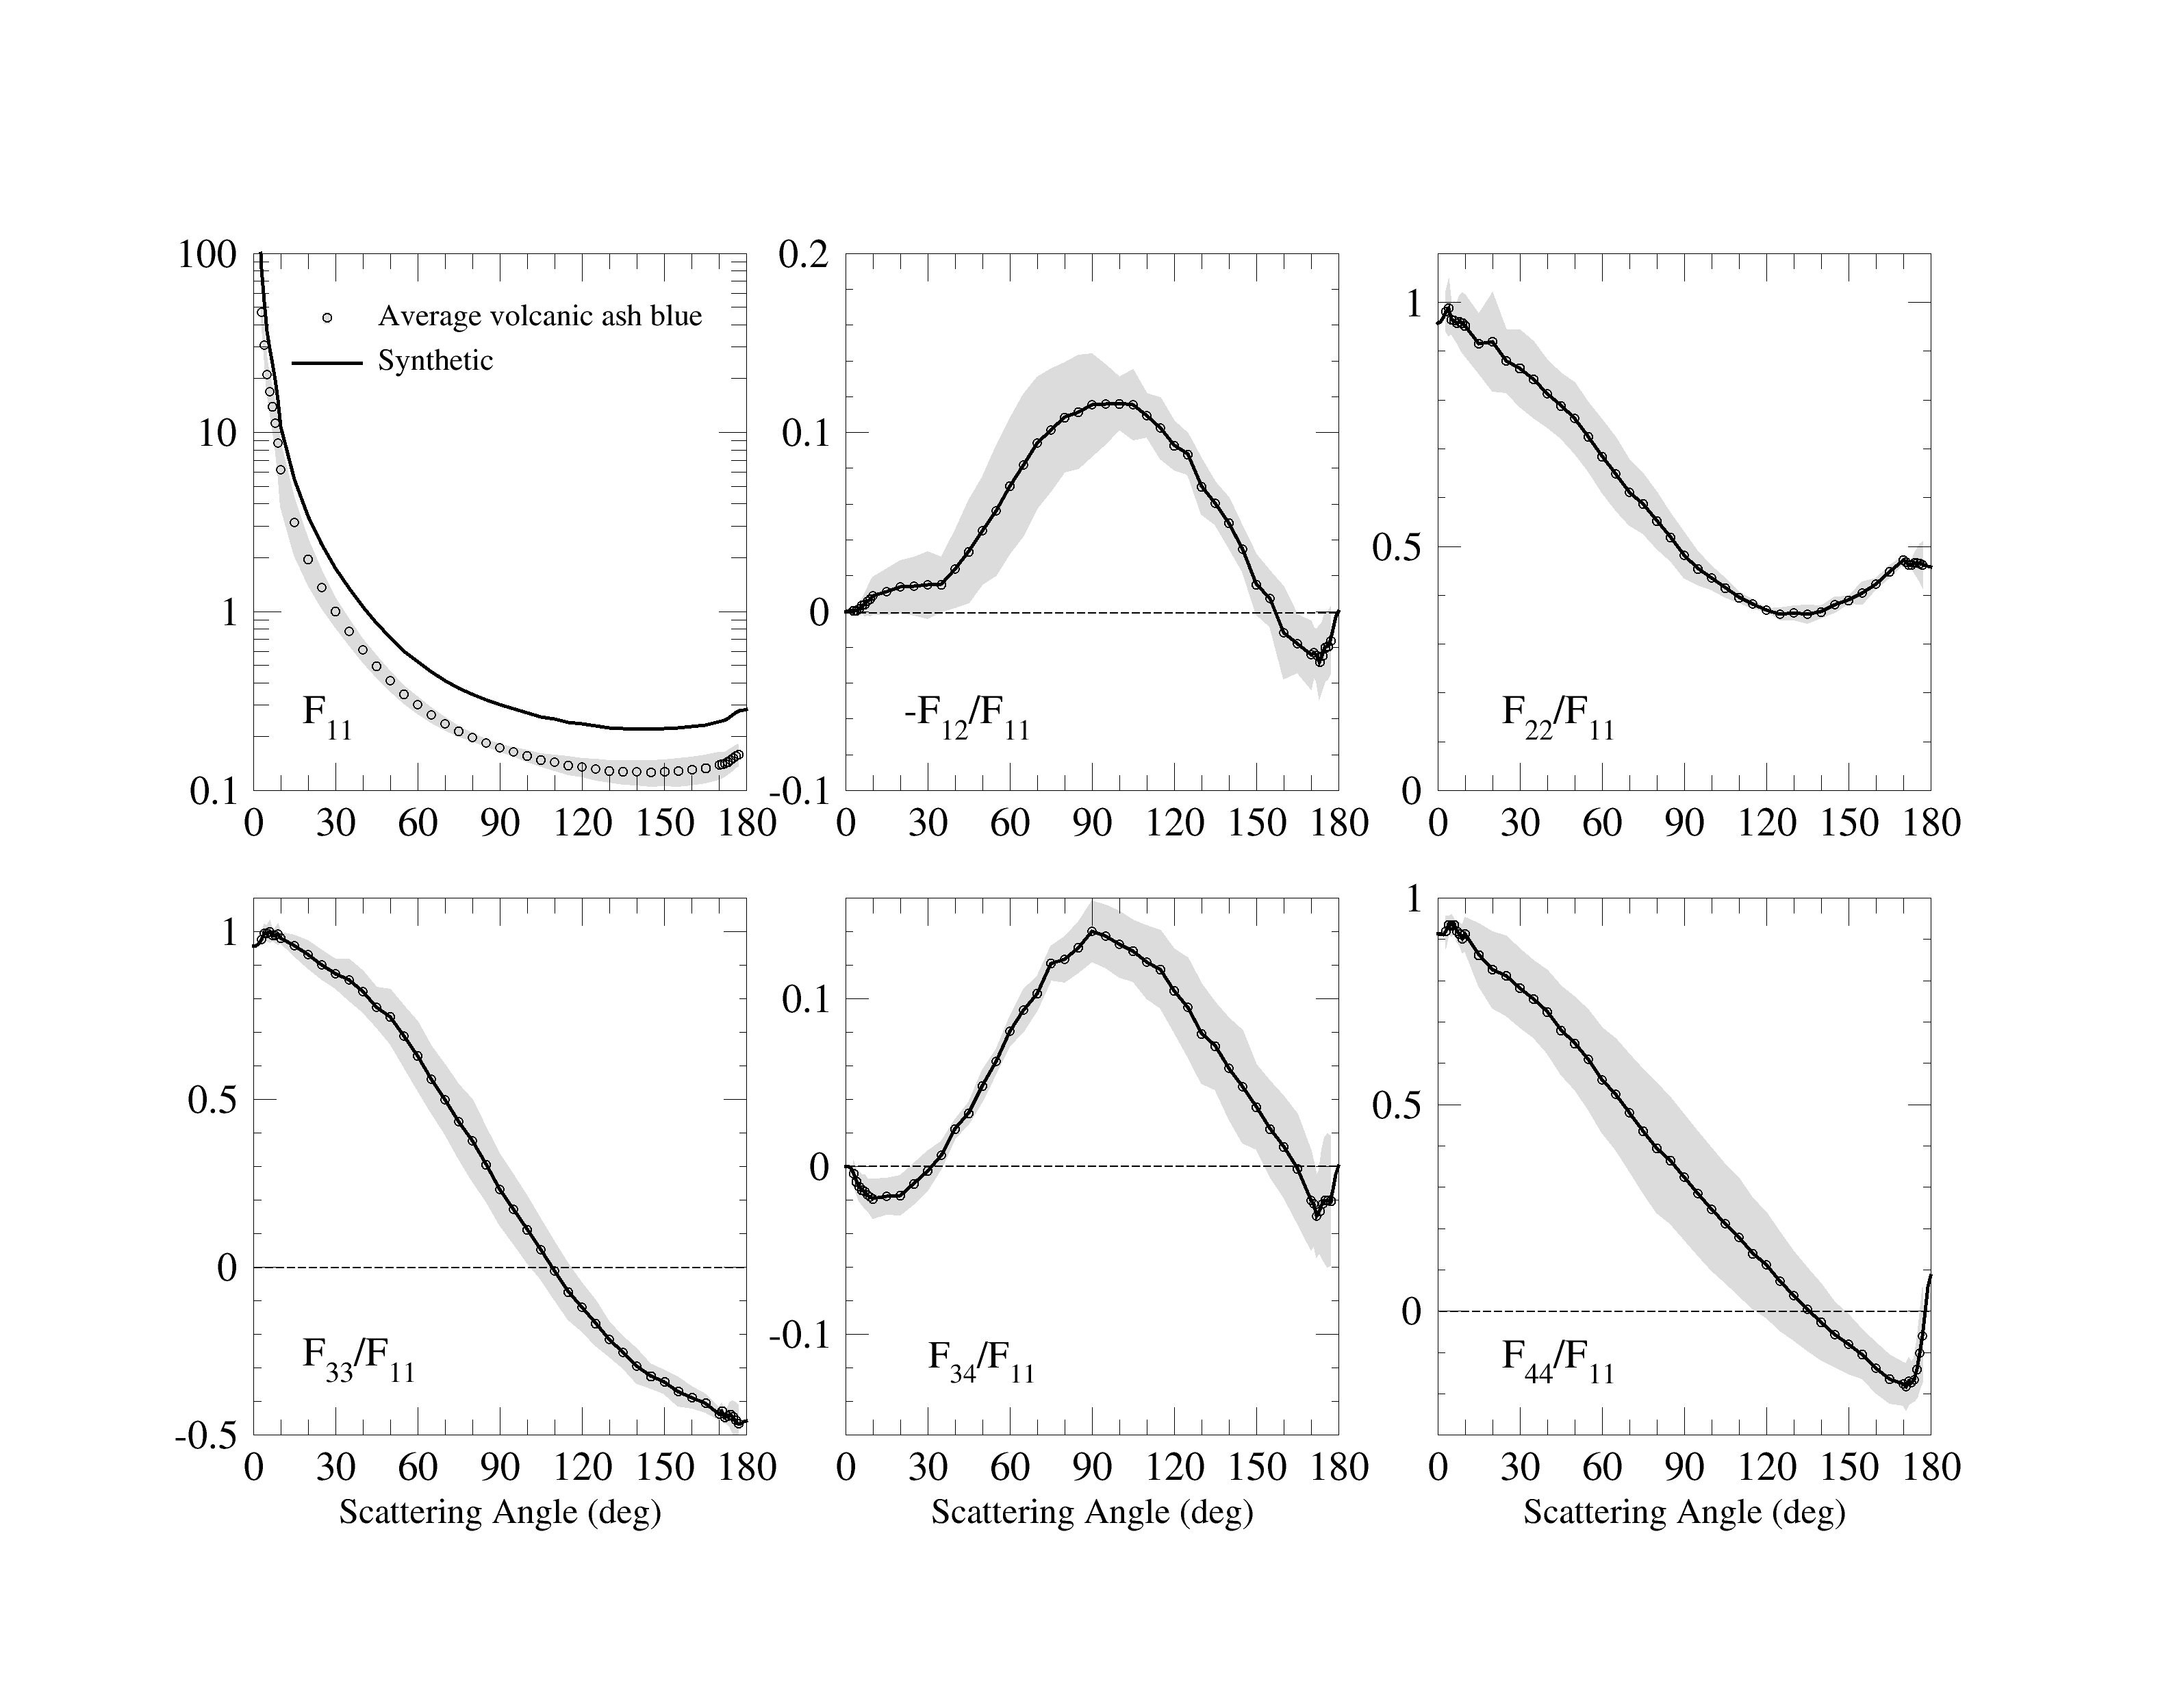
| Average Volcanic Ash (Granada) |
|
|
|
441.6 and 488 nm (table)
632.8 and 647 nm (table) |
441.6 and 488 nm
(tableM, plotM)
632.8
and 647 nm
(tableM, plotM) |
Gómez Martín et al. 2021
|
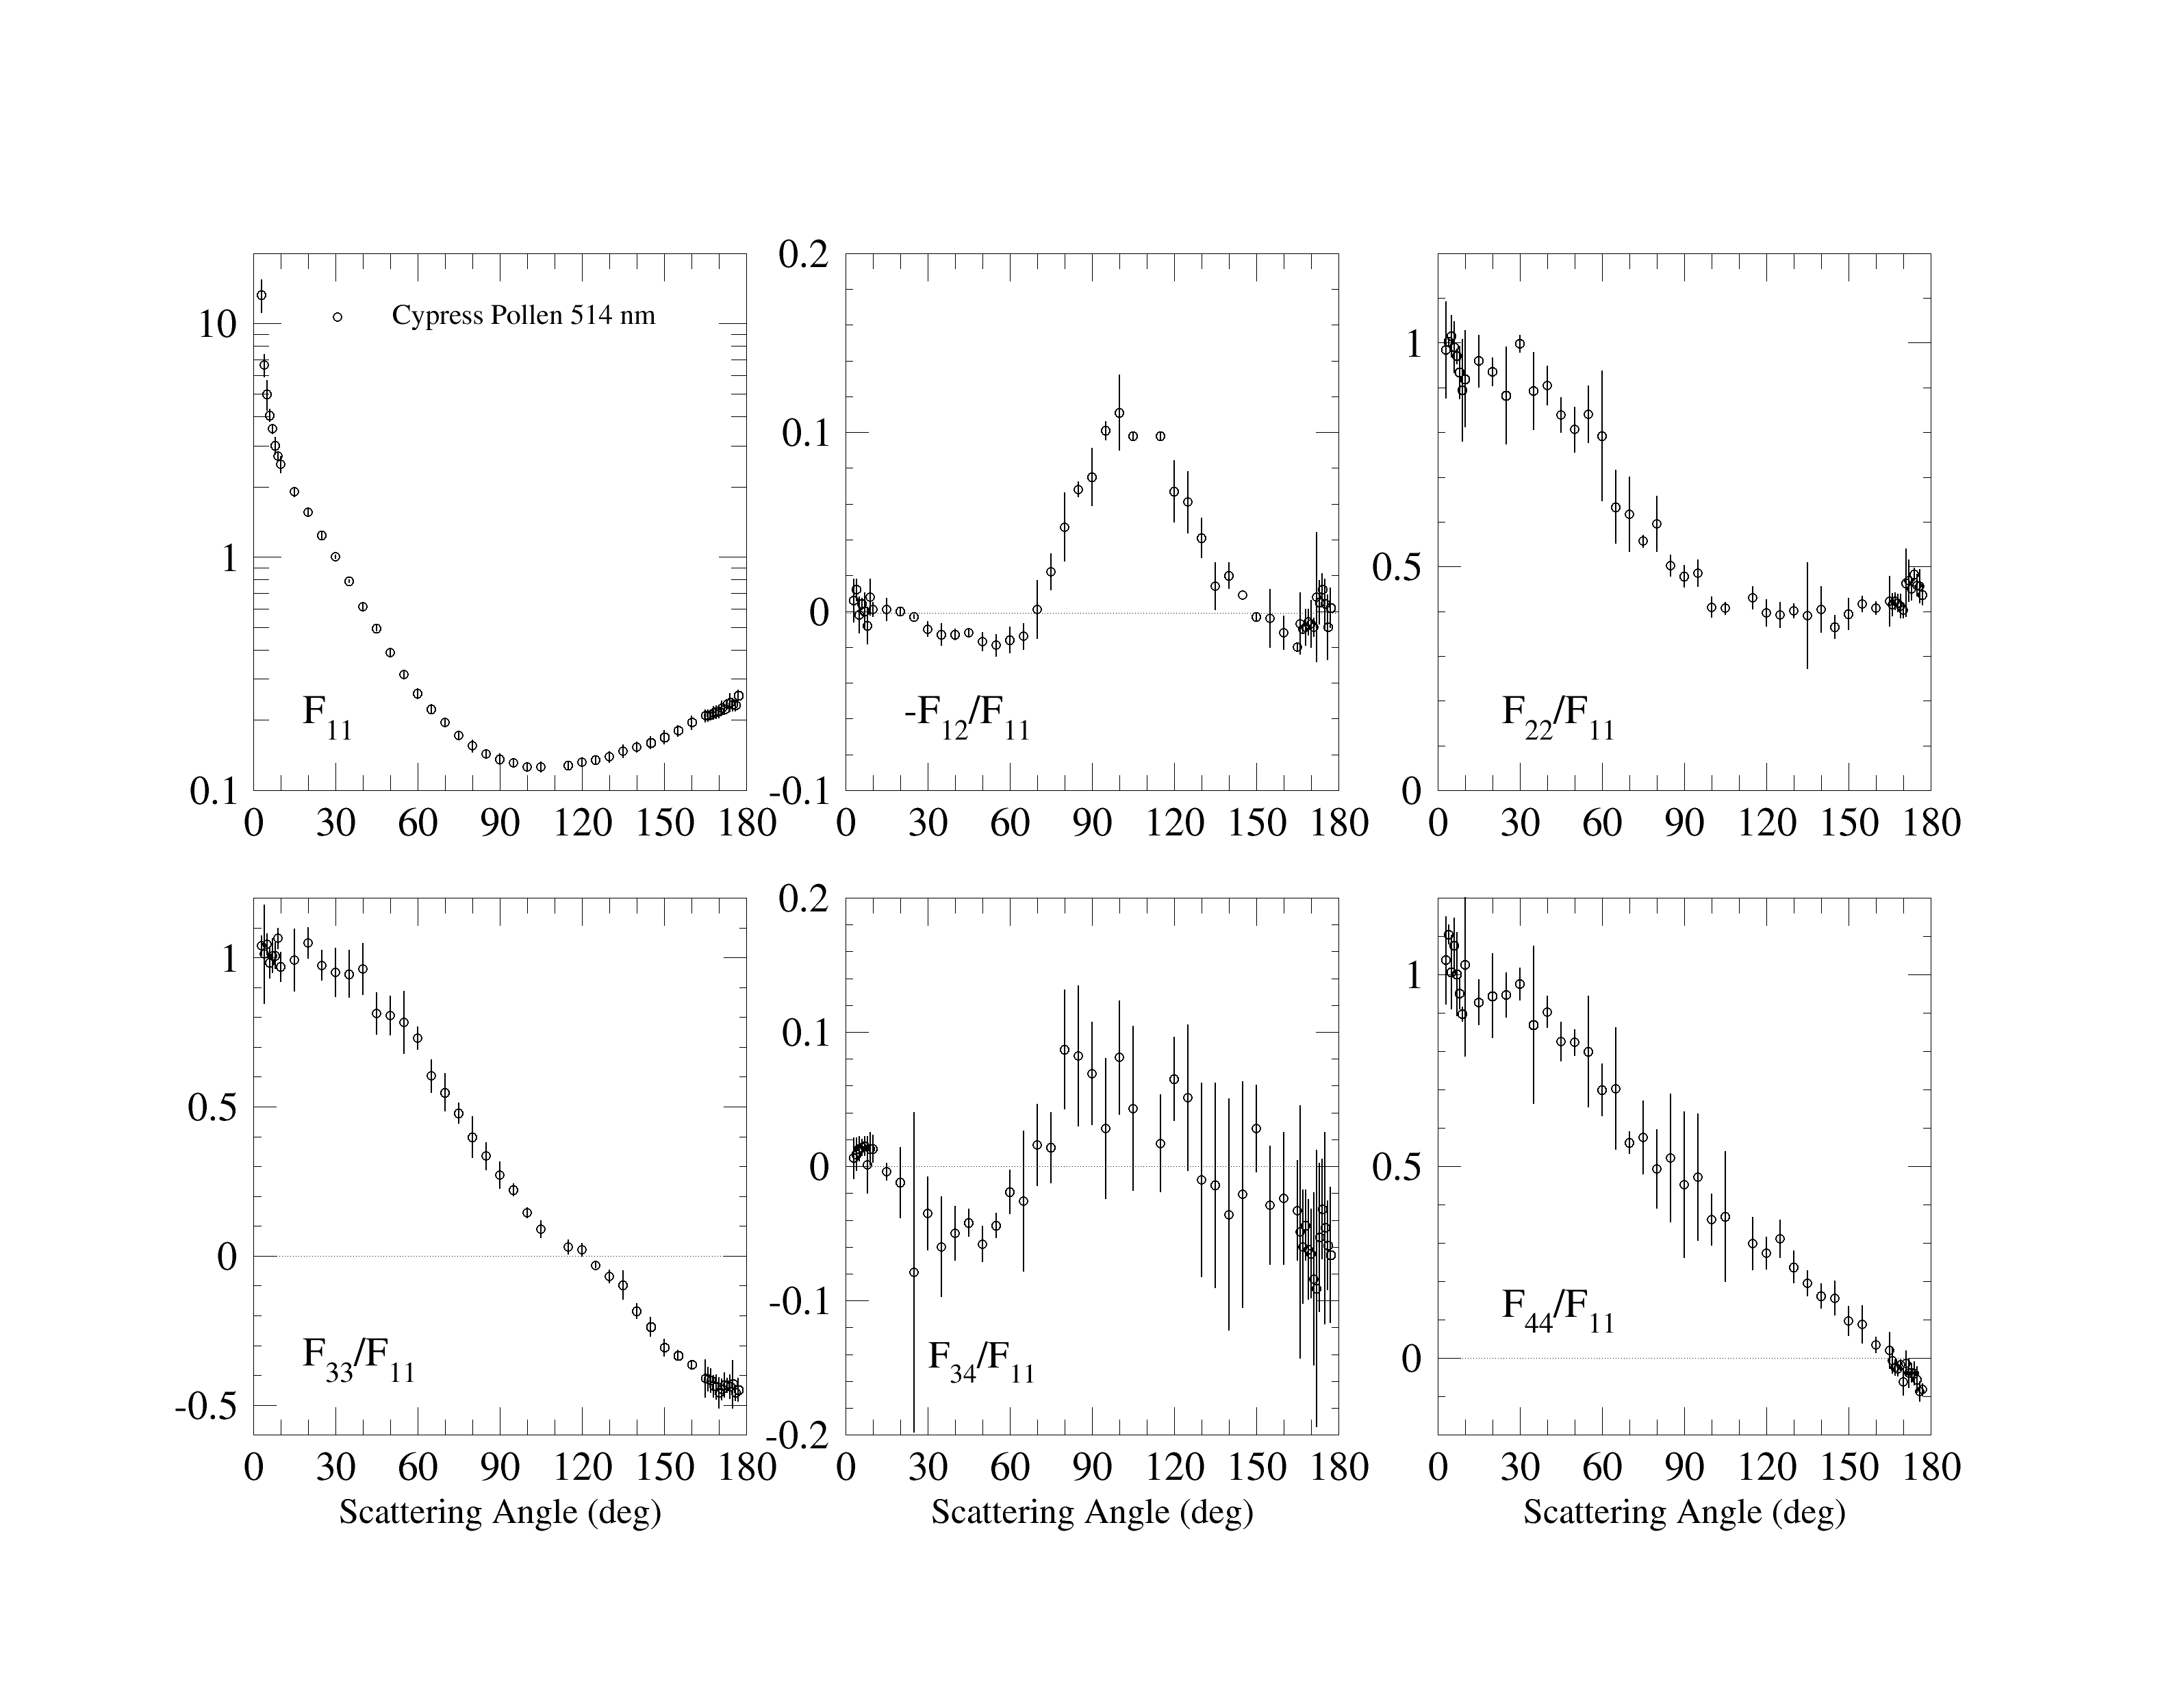
| Cypress Pollen |
|
View |
View |
514 nm (plot, table) |
514 nm (tableM) |
Gómez Martín et al. 2021
|
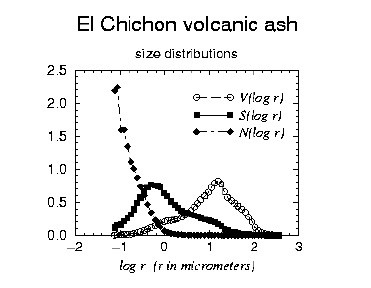
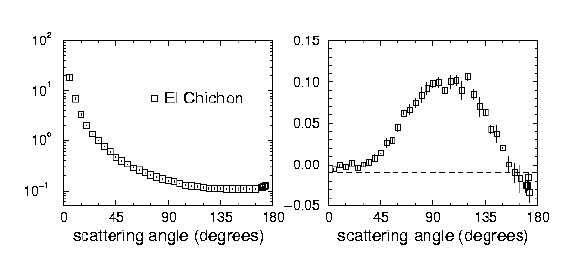
| El Chichón |
plot, table |
|
|
632.8 nm (plot, table) |
|
Muñoz et al. 2002
|
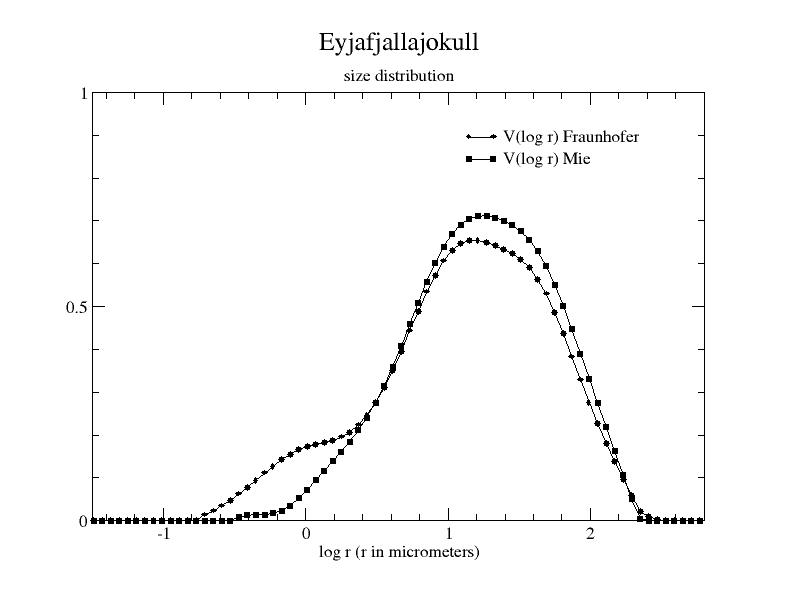
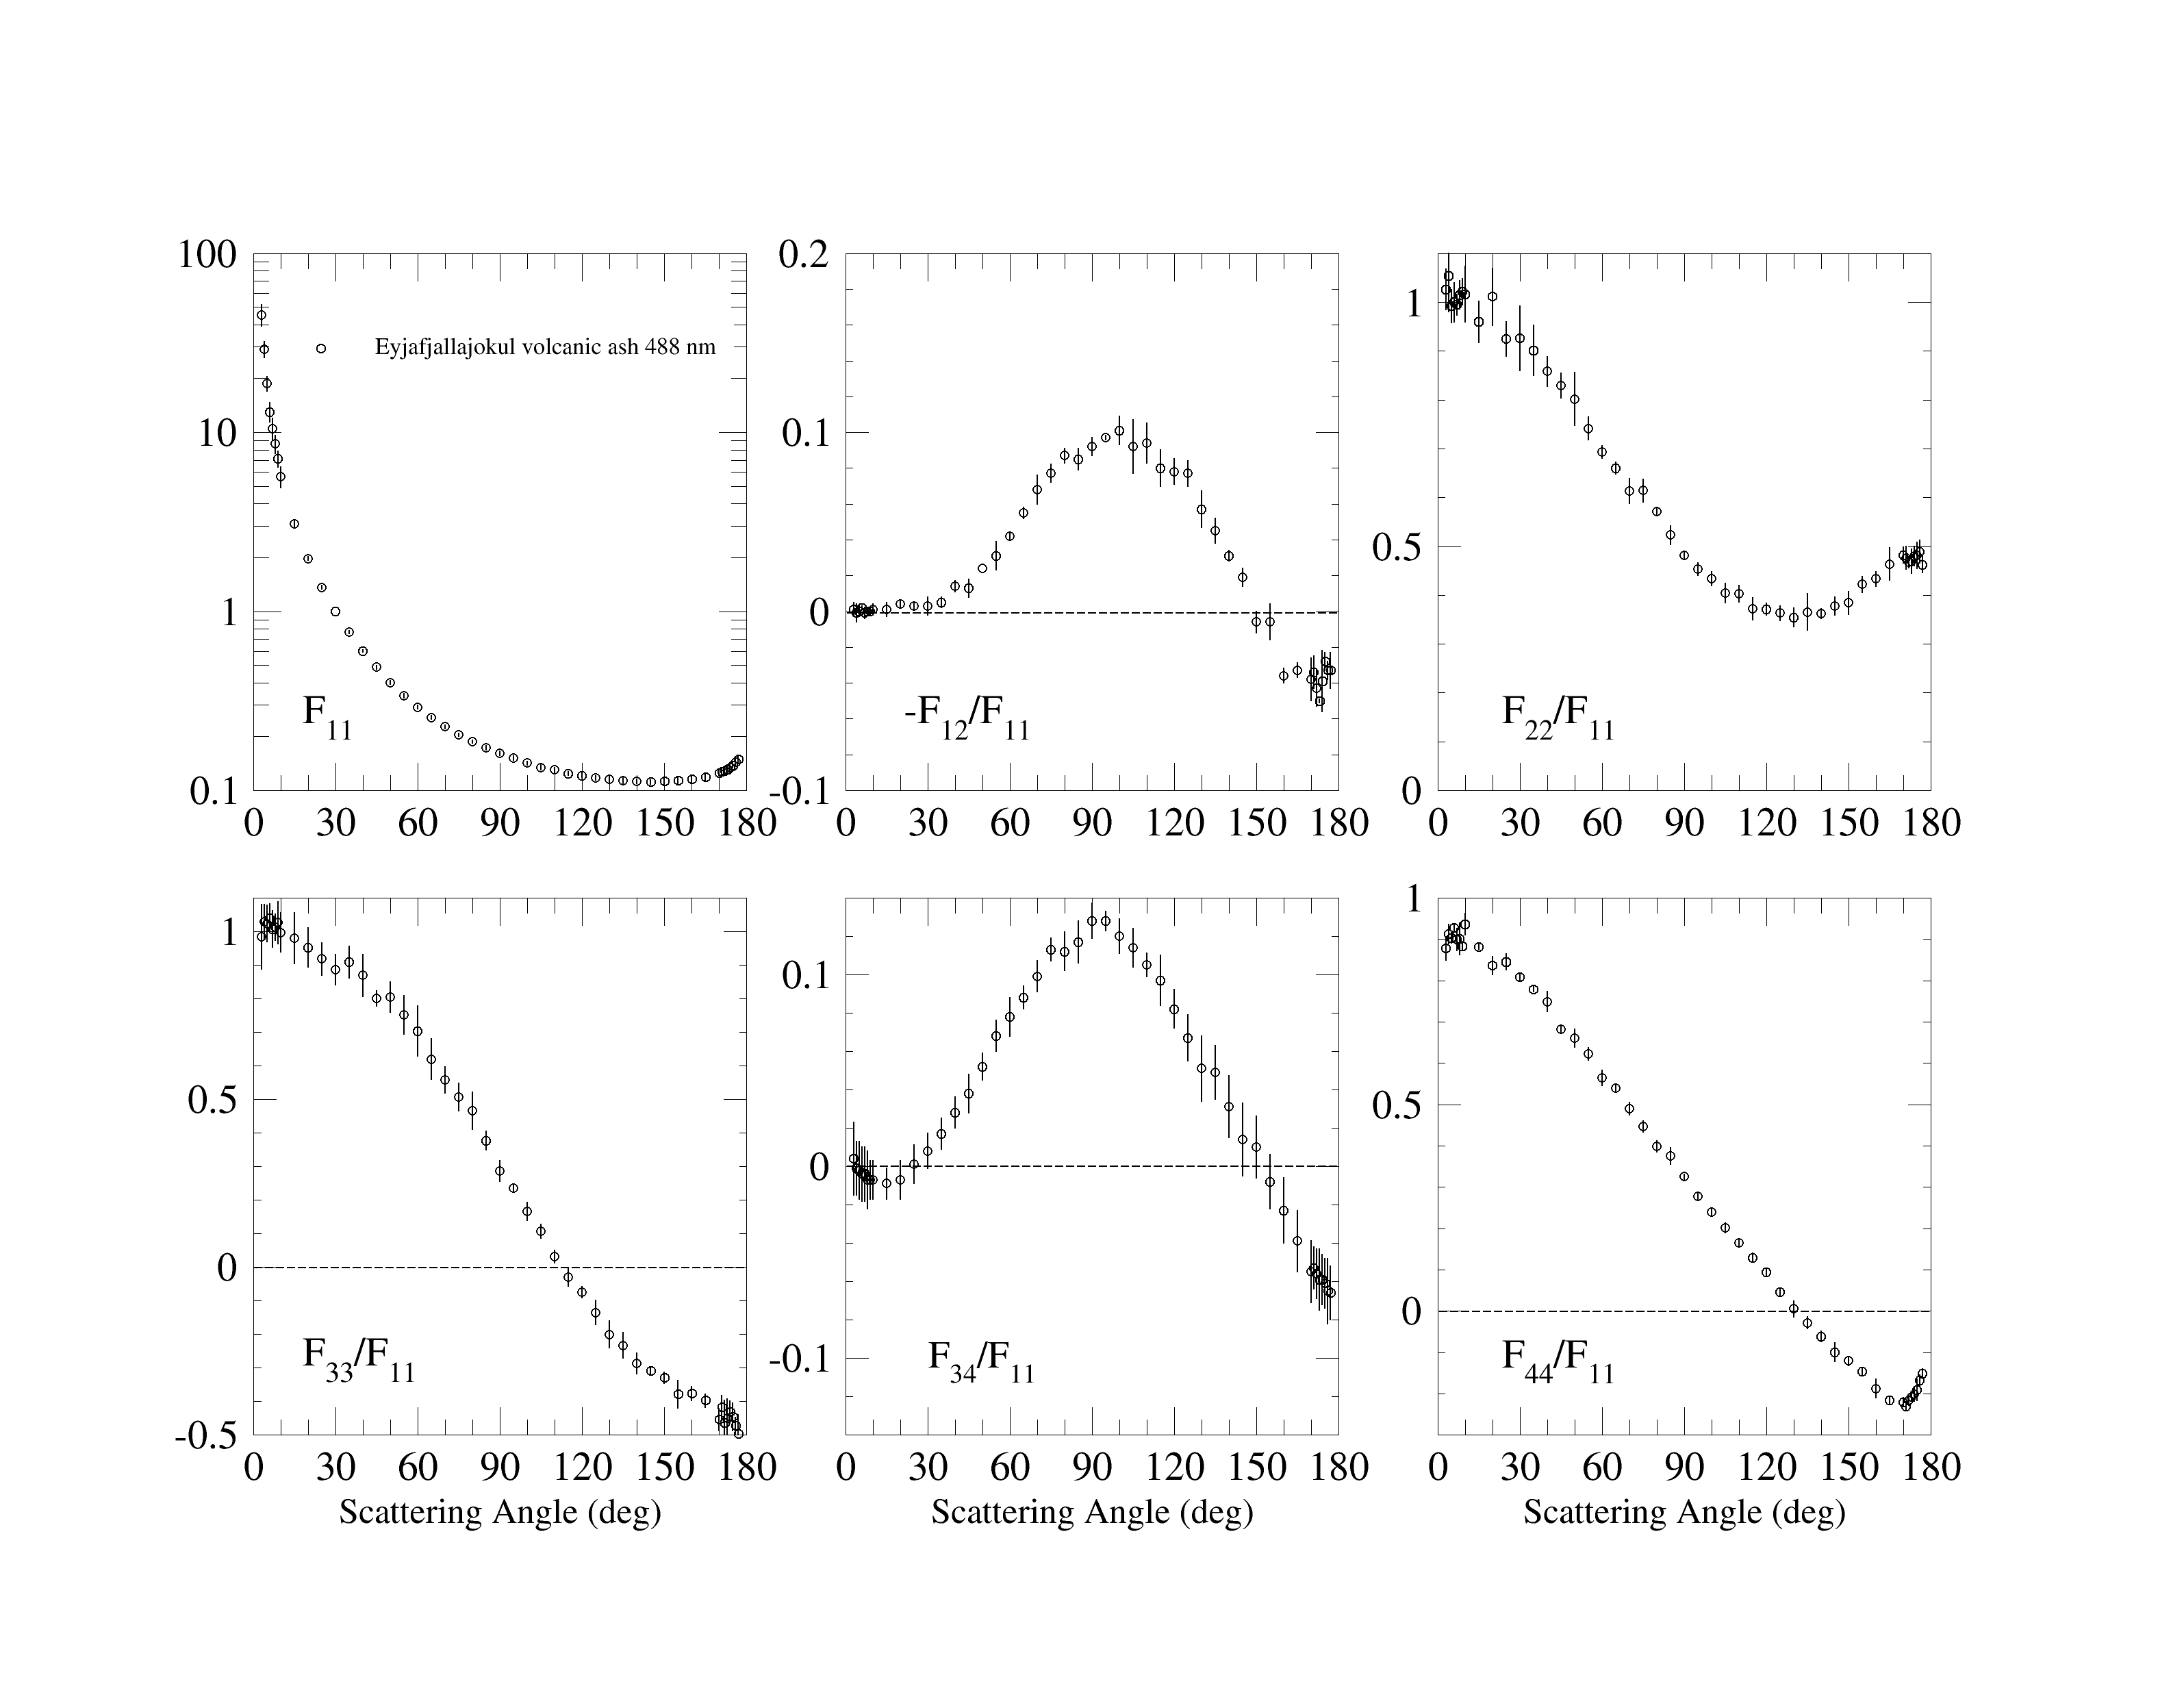
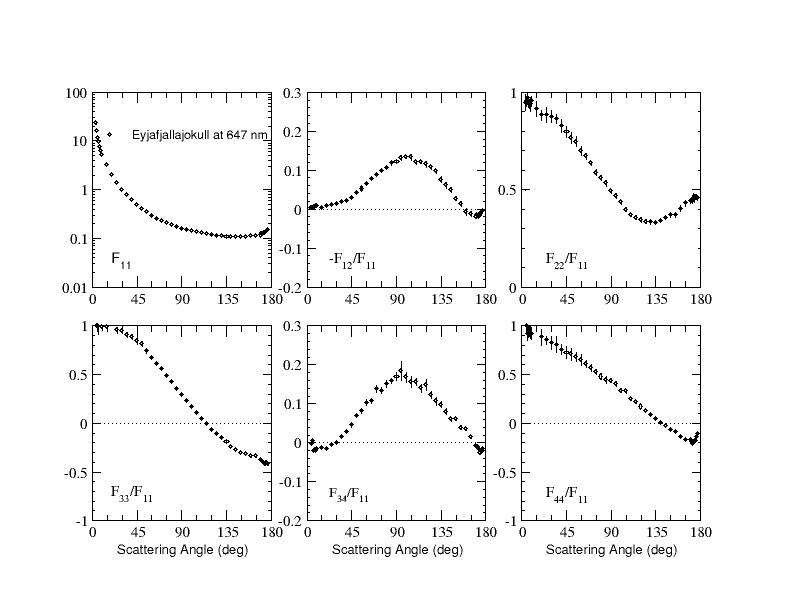
| Eyjafjallajokull |
plot, table |
|
View |
488nm (plot, table)
647nm (plot, table) |
647 nm (tableM, tableF) |
Merikallio et al. 2015
Gómez Martín et al. 2021
|
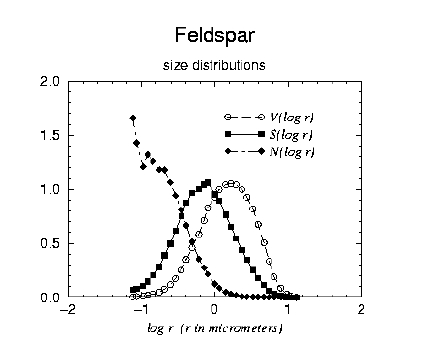
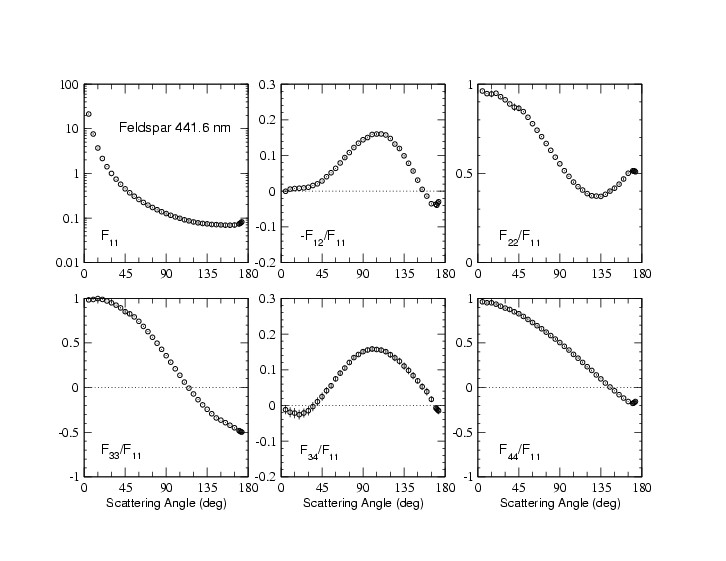
| Feldspar |
plot, table |
|
View |
441.6 nm (plot, table)
632.8 nm (plot, table) |
|
Volten et al. 2001
|
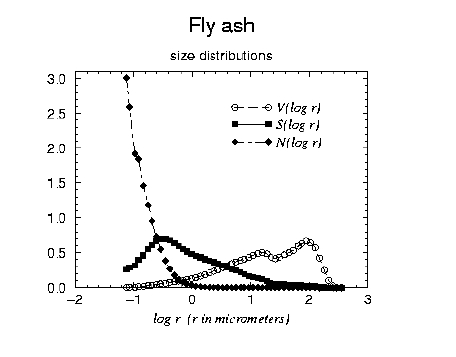
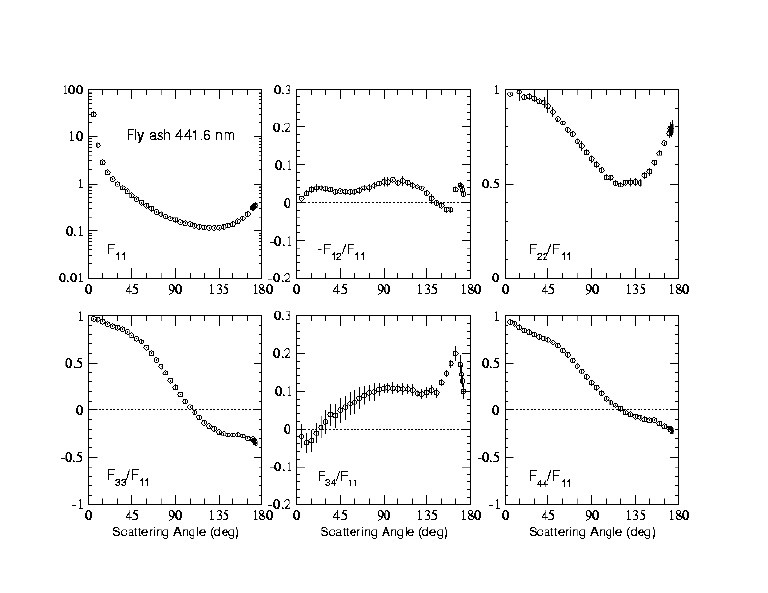
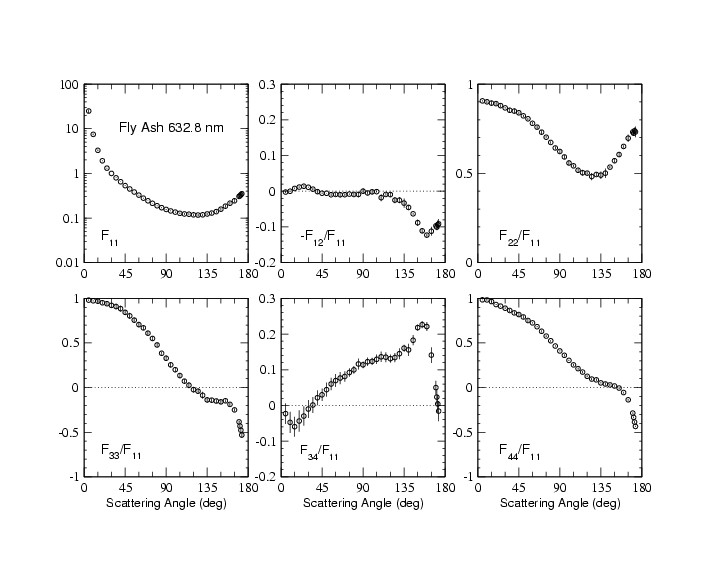
| Fly Ash |
plot, table |
|
View |
441.6 nm (plot, table)
632.8 nm (plot, table) |
|
Muñoz et al. 2001
|
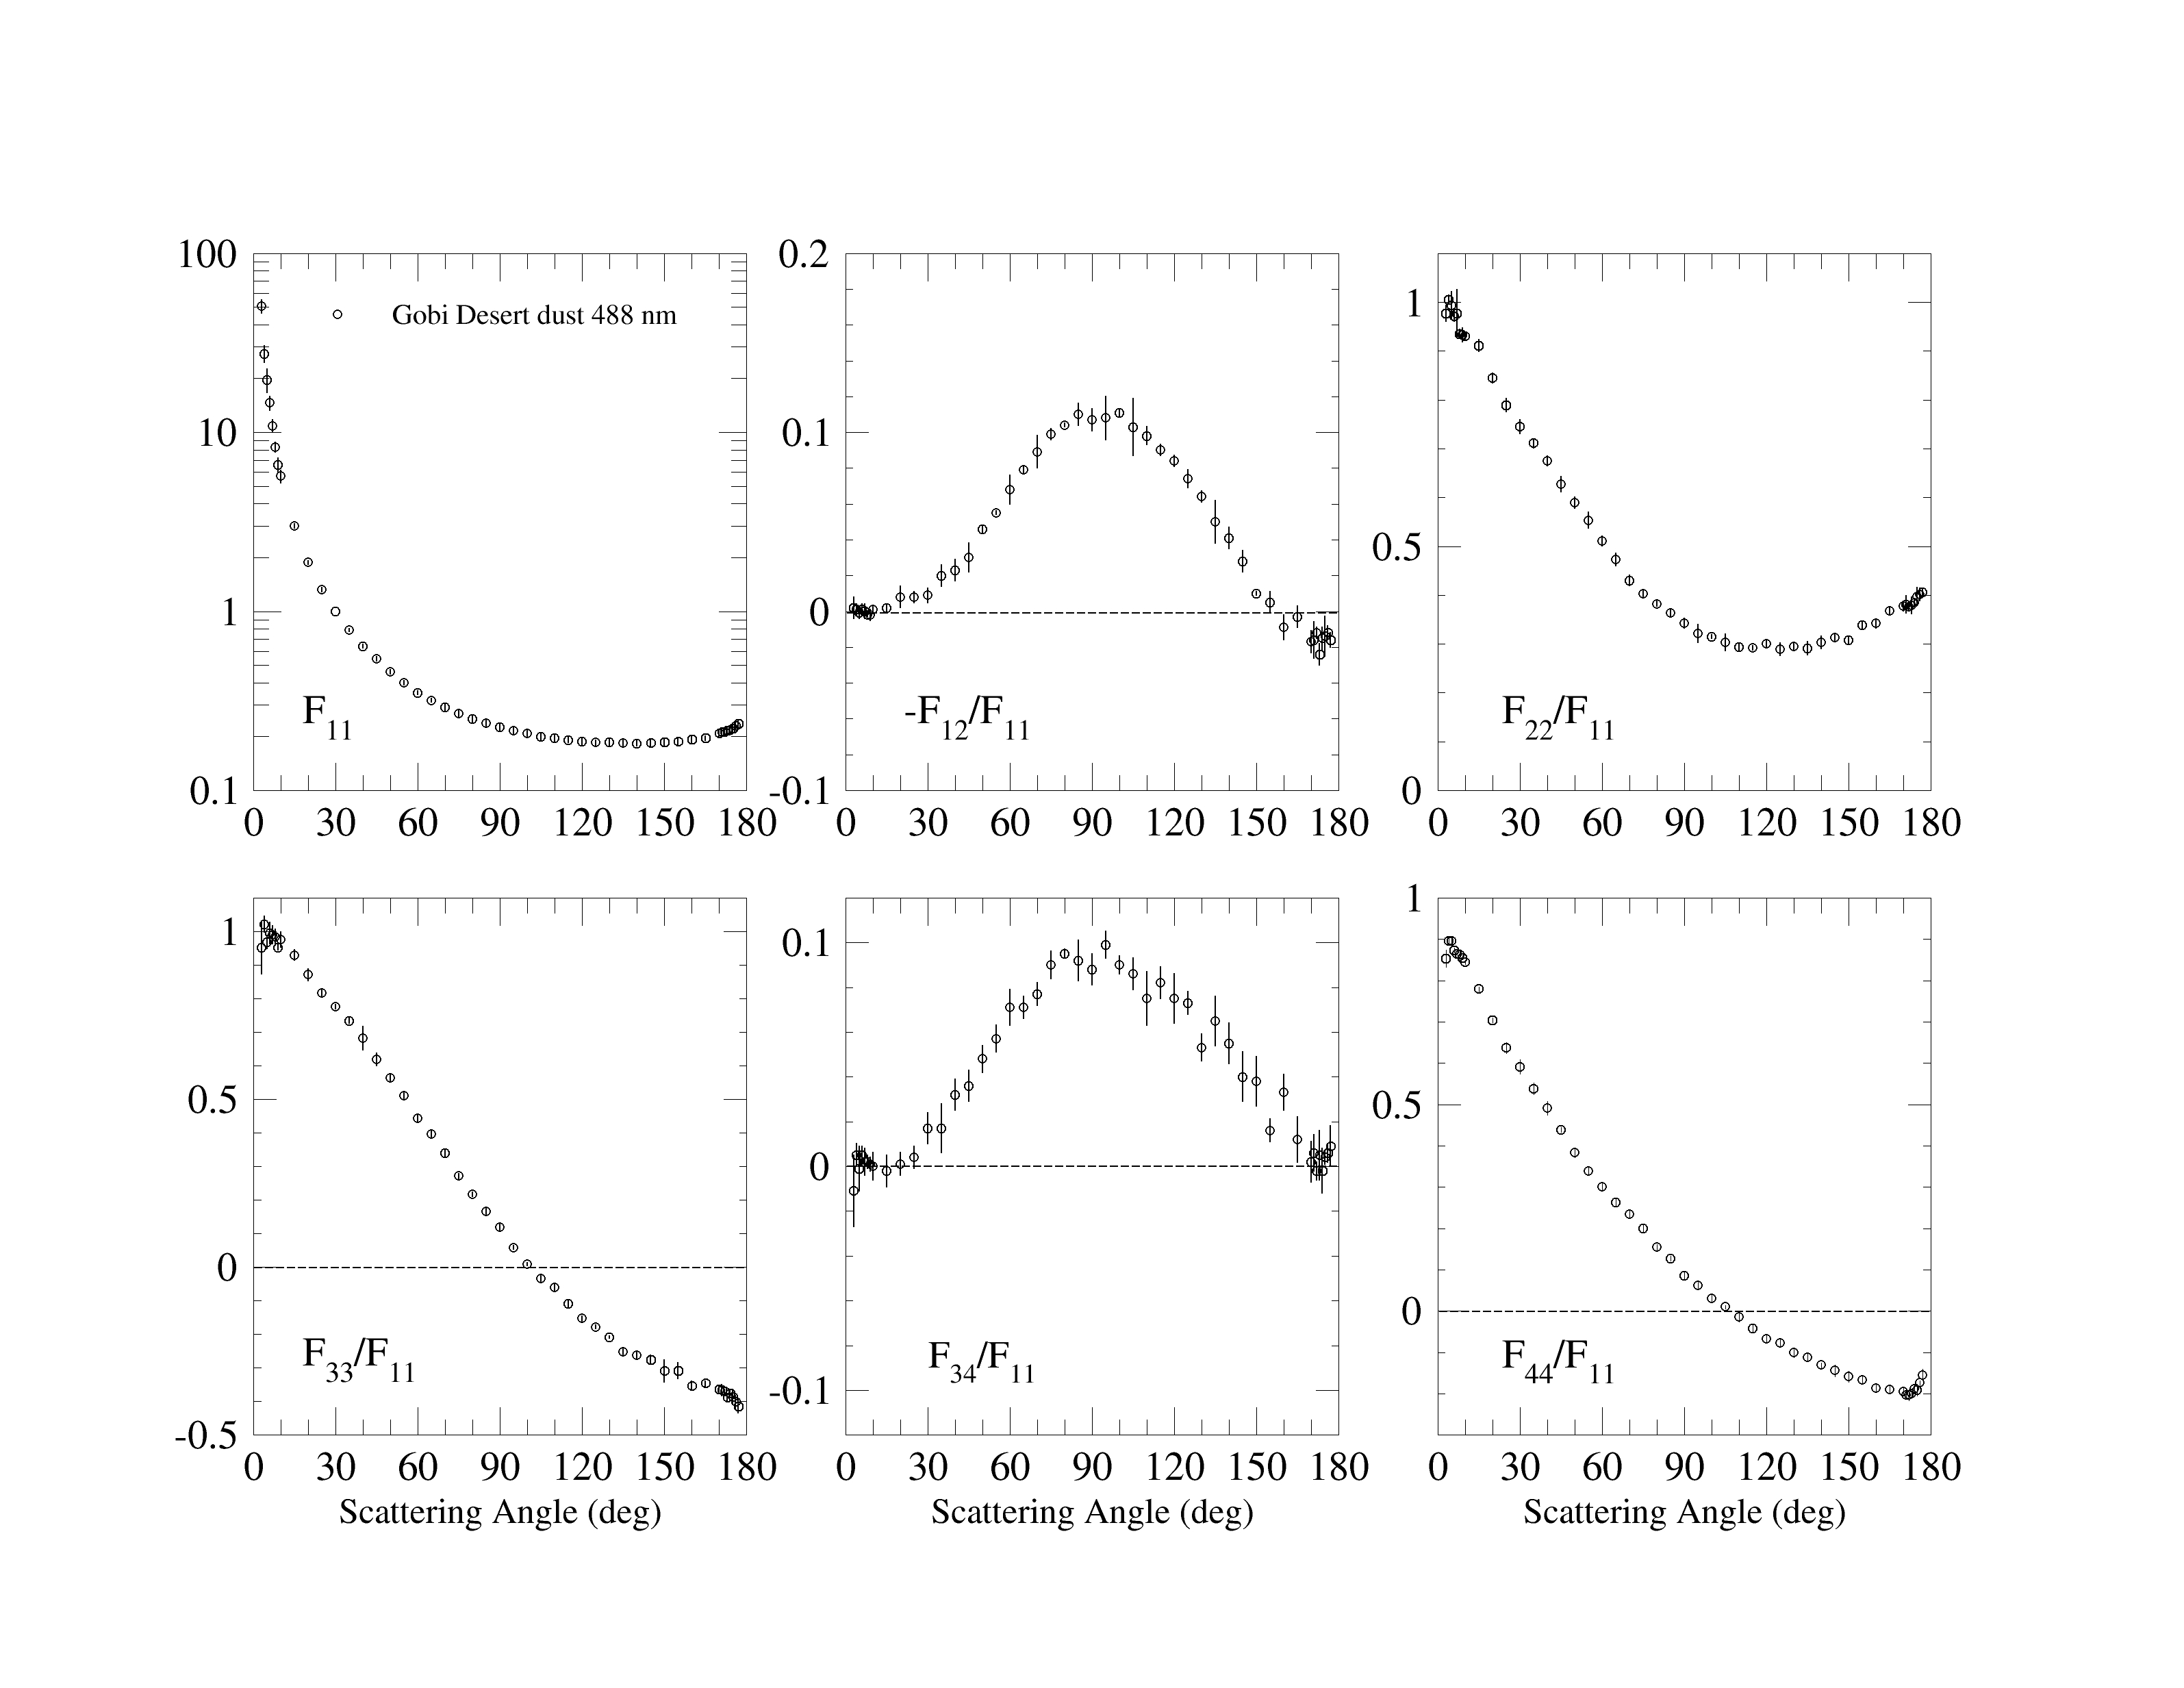
| Gobi Desert Dust |
plot |
|
View |
488 nm (plot, table)
647 nm (plot, table) |
|
Gómez Martín et al. 2021
|
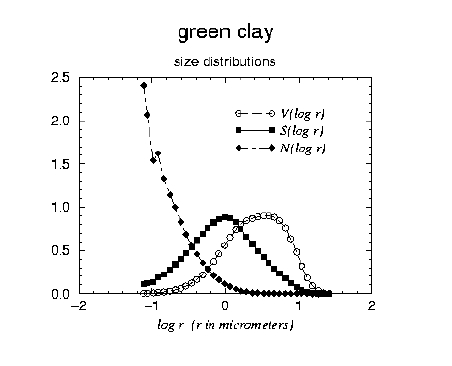
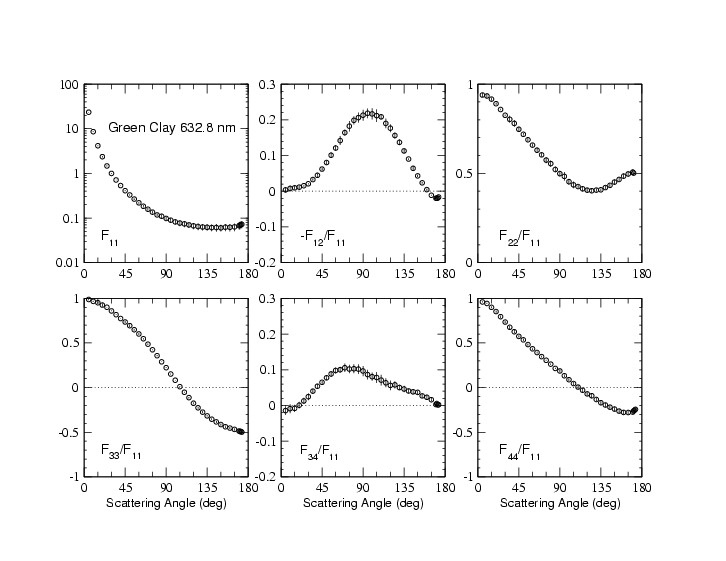
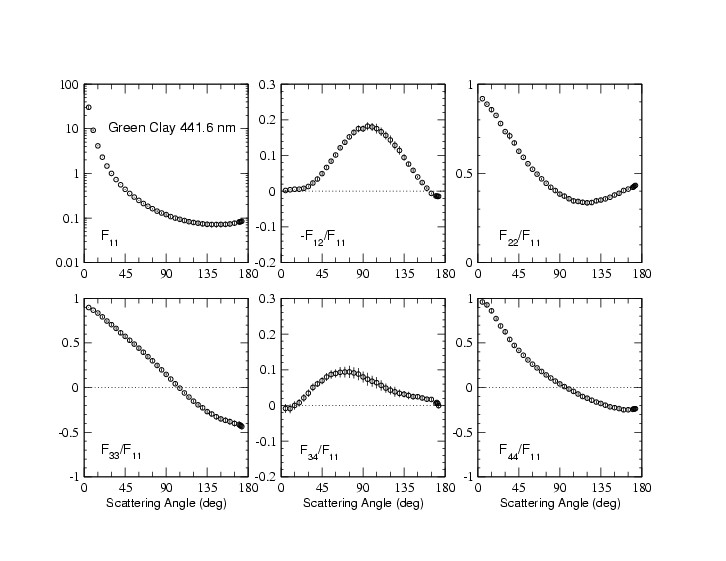
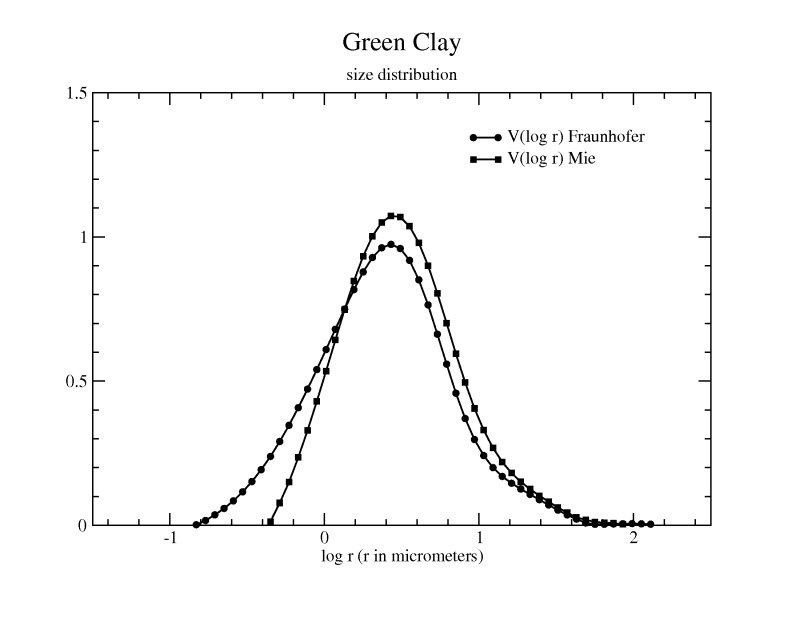
| Green Clay (Amsterdam) |
plot, table |
|
View |
632.8nm (plot, table)
441.6nm (plot, table) |
|
Muñoz et al. 2001 |
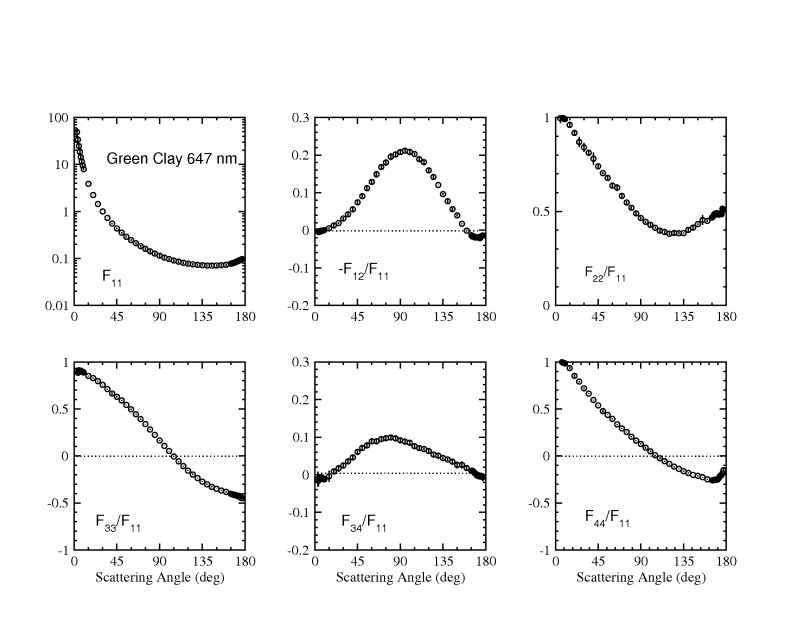
| Green Clay (Granada) |
plot, table |
|
View |
647nm (plot, table) |
|
Muñoz et al. 2011 |
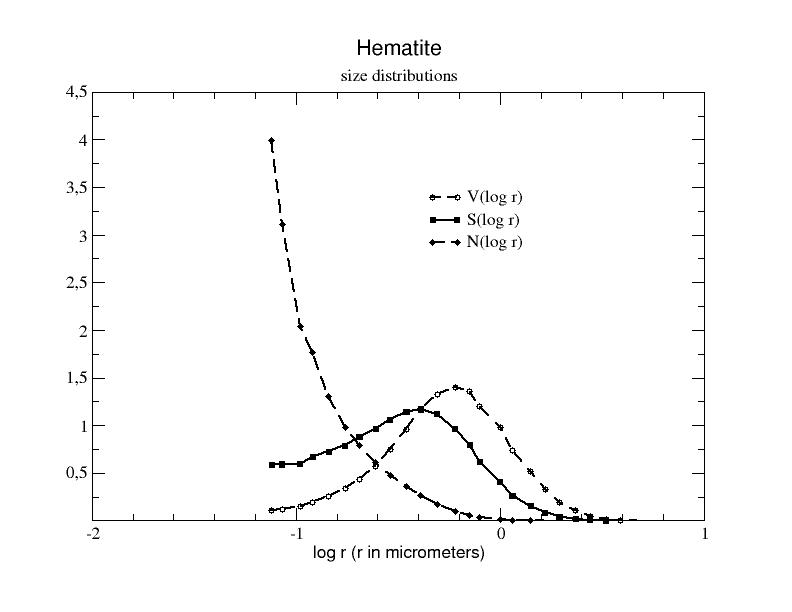
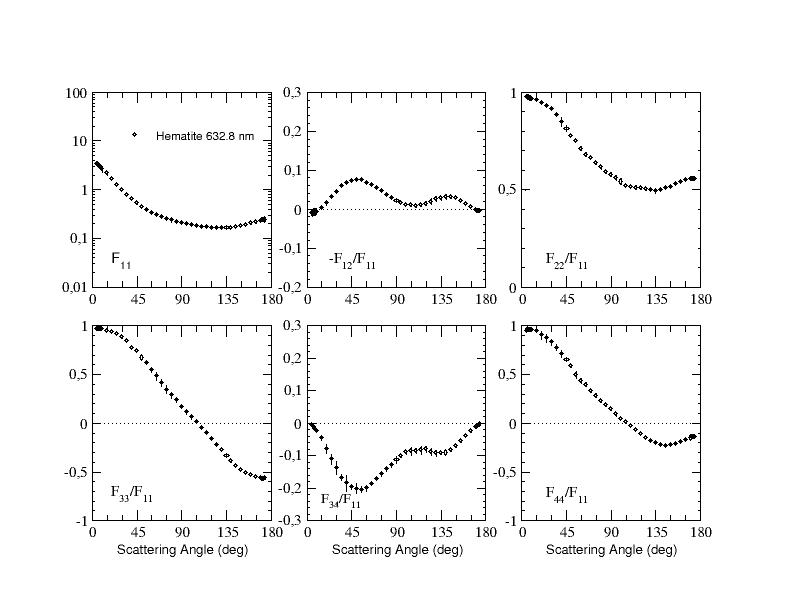
| Hematite |
plot, table |
|
View |
632.8 nm (plot, table) |
|
Muñoz et al. 2006
|
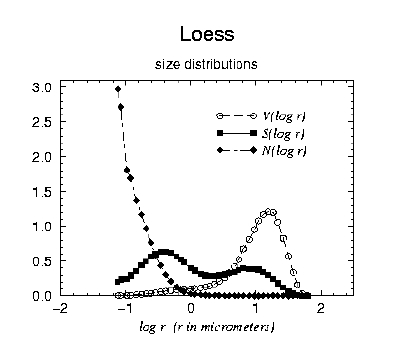
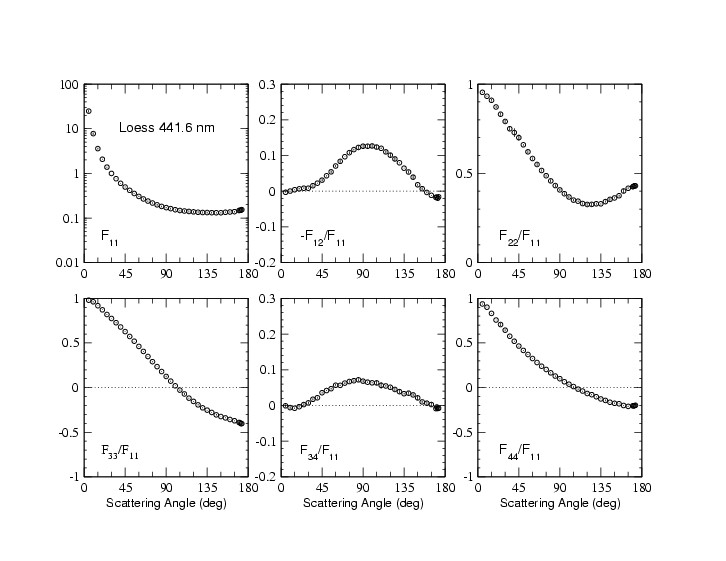
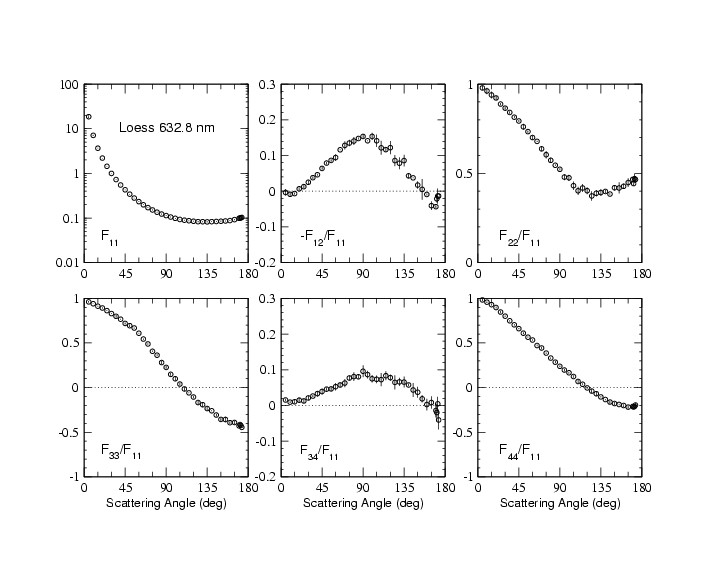
| Loess |
plot, table |
|
View |
441.6 nm (plot, table)
632.8 nm (plot, table) |
|
Volten et al. 2001
|
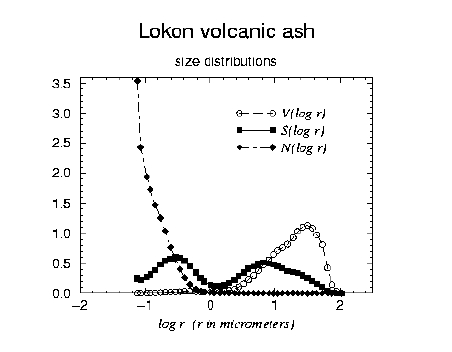
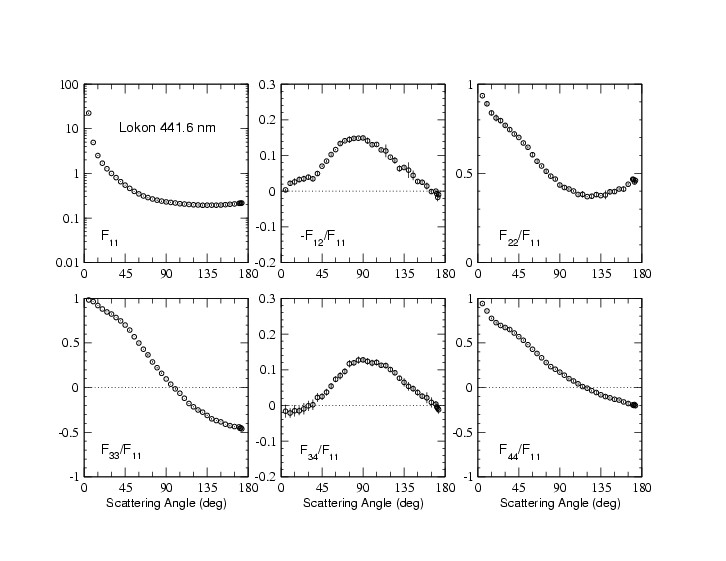
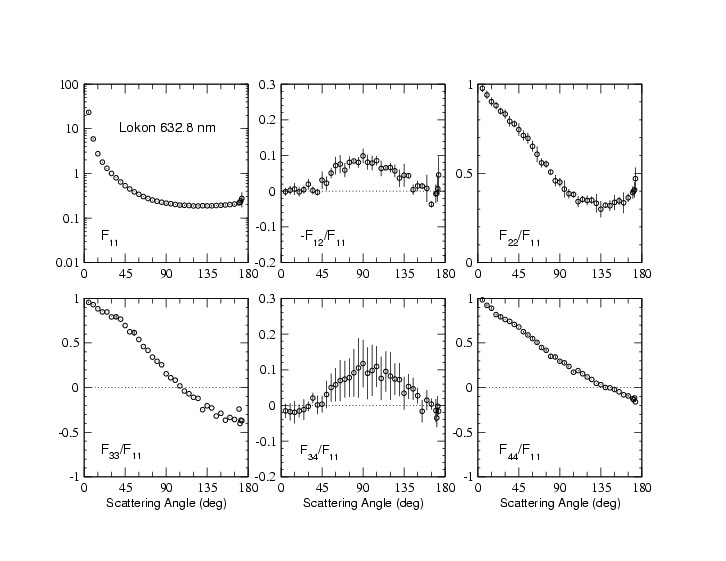
| Lokon |
plot, table |
|
View |
441.6 nm (plot, table)
632.8 nm (plot, table) |
|
Volten et al. 2001
|
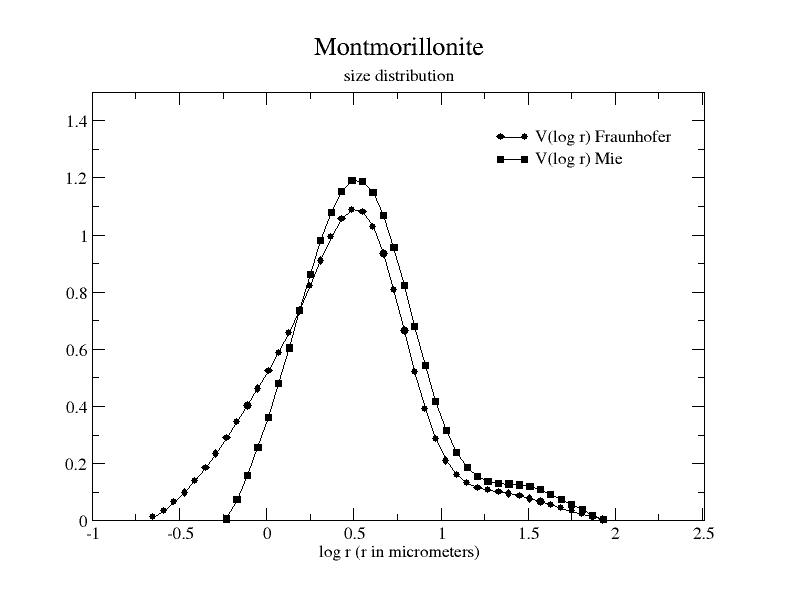
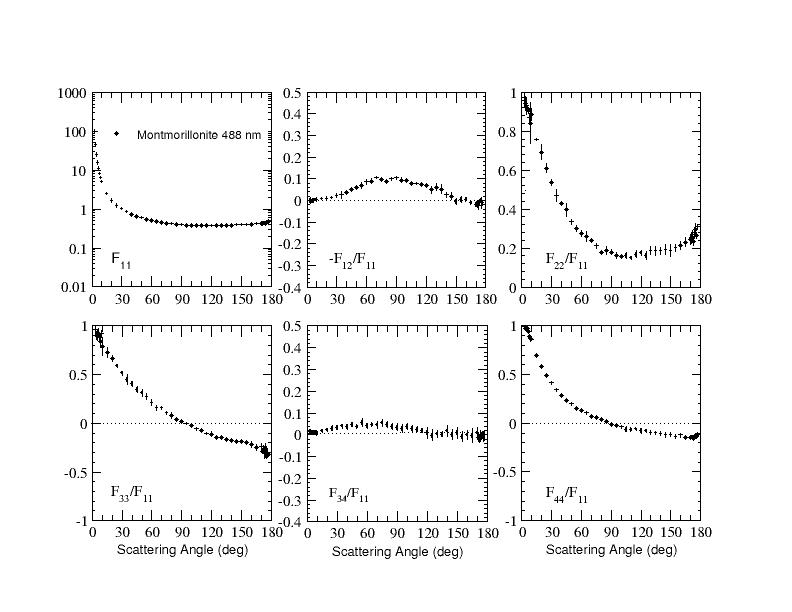
| Montmorillonite |
plot, table |
|
View |
488nm (plot, table) |
488nm (tableM, tableF) |
Dabrowska et al. 2015
|
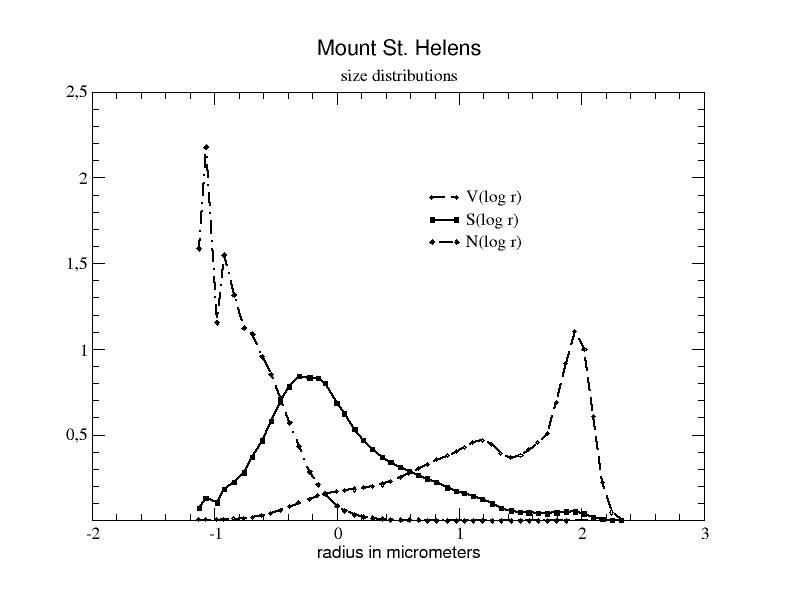
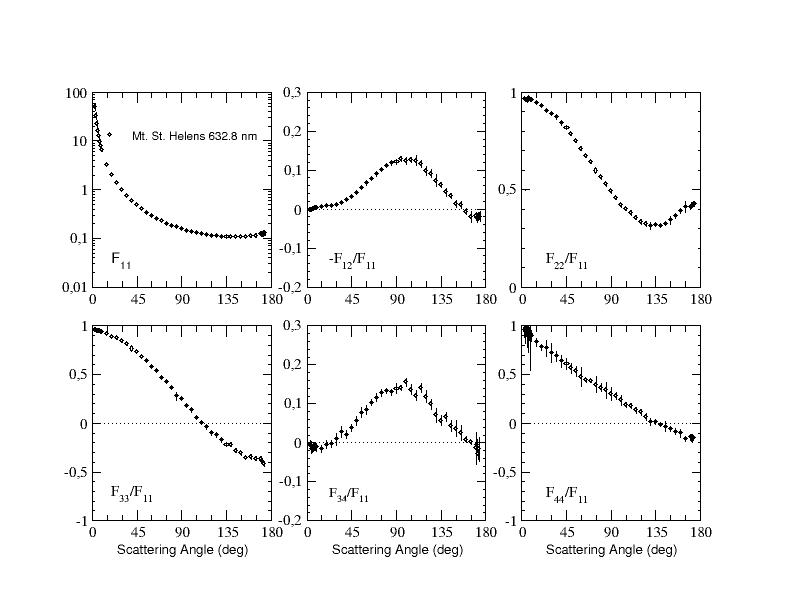
| Mount St. Helens |
plot, table |
|
View |
632.8 nm (plot, table) |
|
Muñoz et al. 2004
|
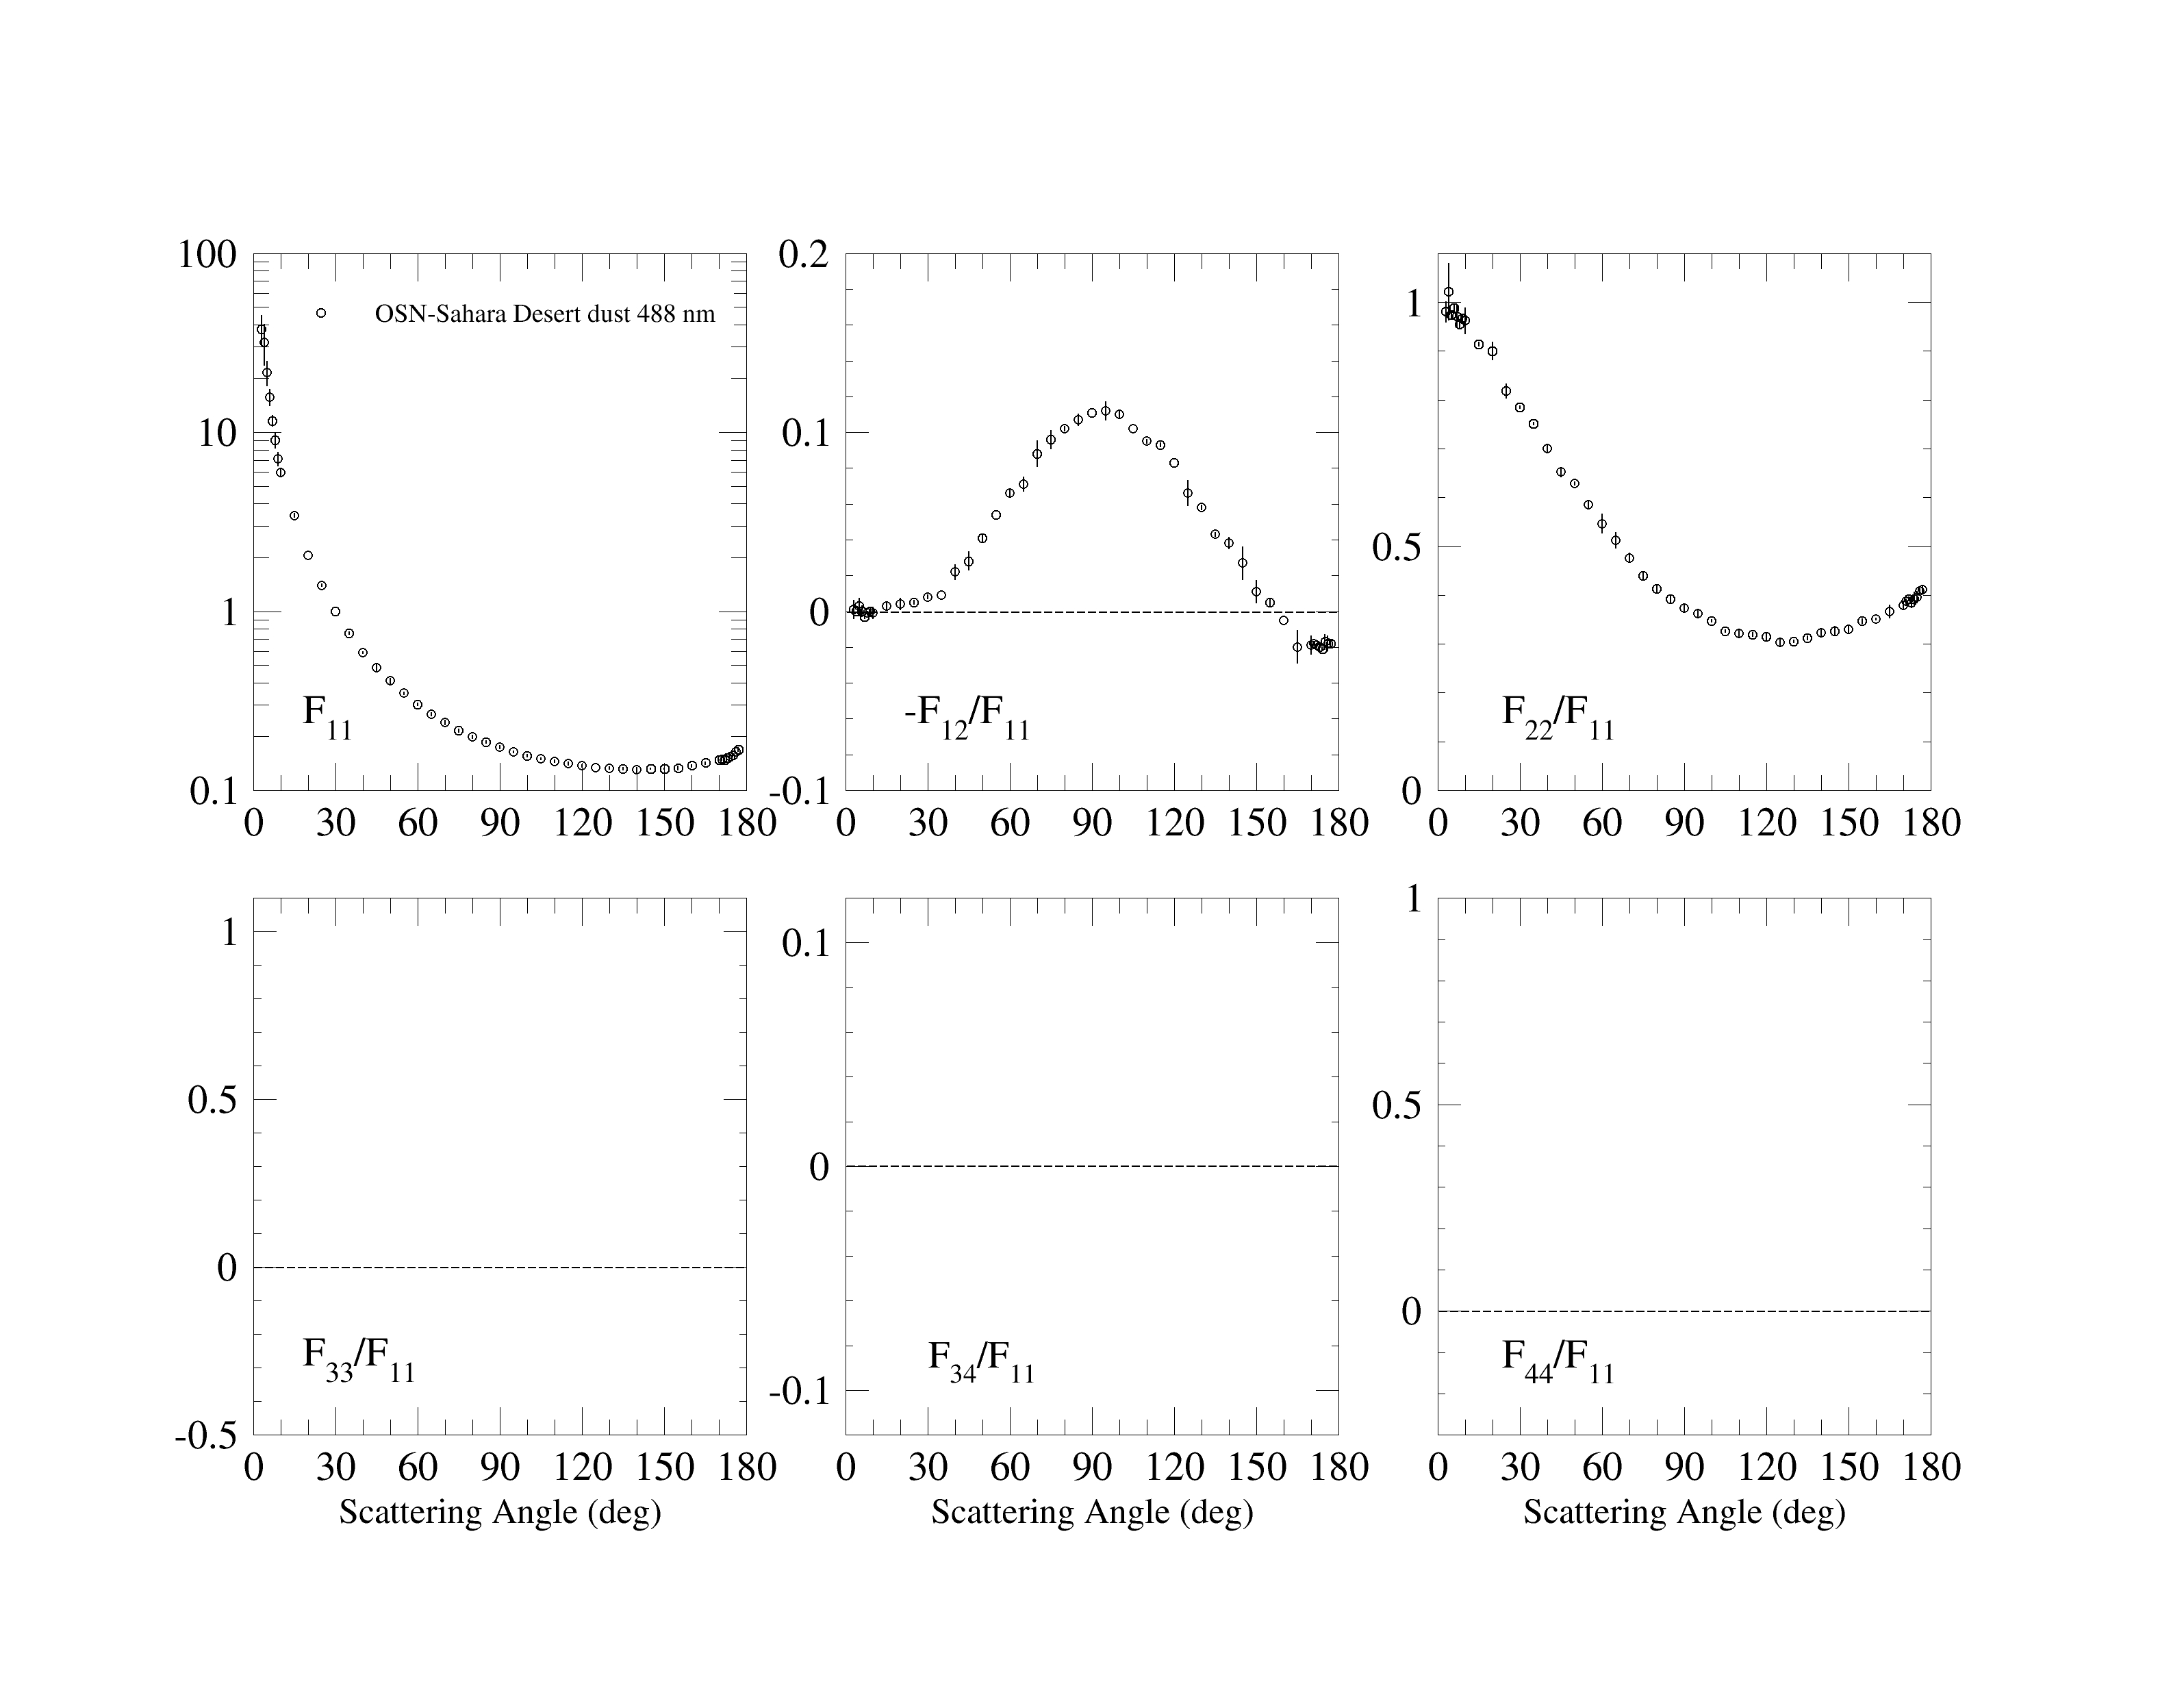
| OSN - Sahara Desert Dust |
plot |
|
View |
488 nm (plot, table)
647 nm (plot, table) |
|
Gómez Martín et al. 2021
|
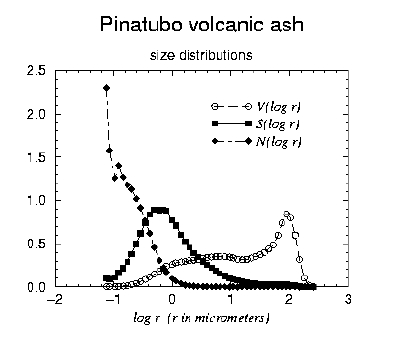
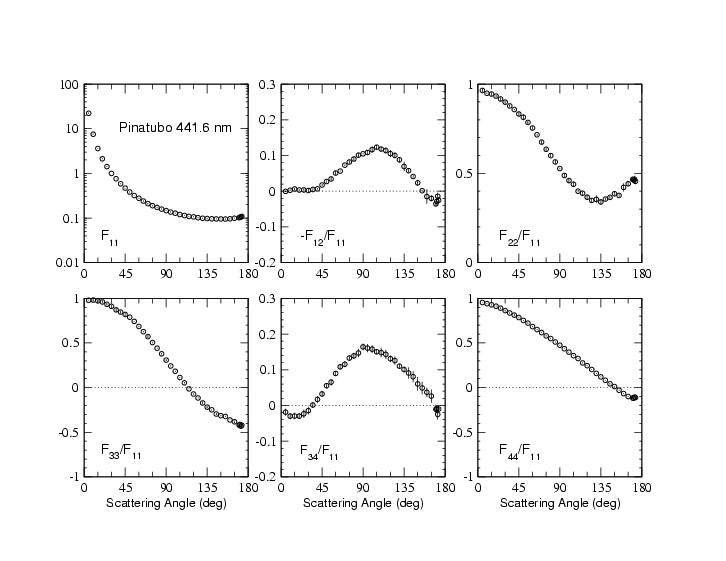
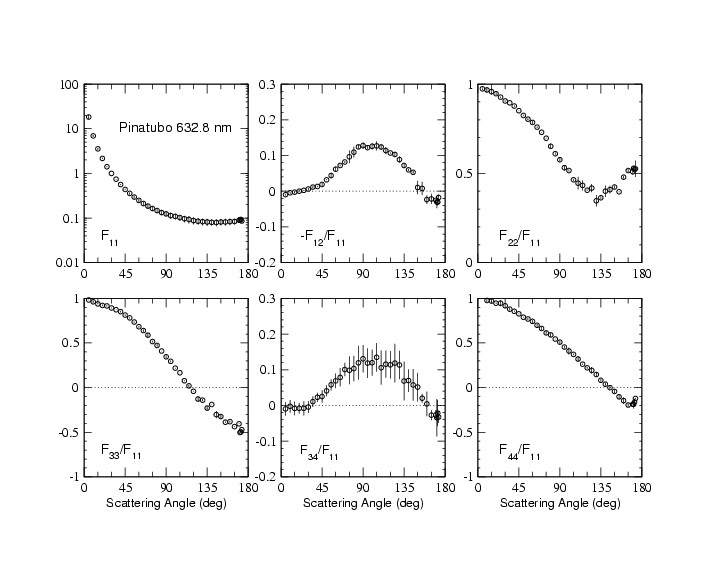
| Pinatubo |
plot, table |
|
View |
441.6 nm (plot, table)
632.8 nm (plot, table) |
|
Volten et al. 2001
Muñoz et al. 2002
|
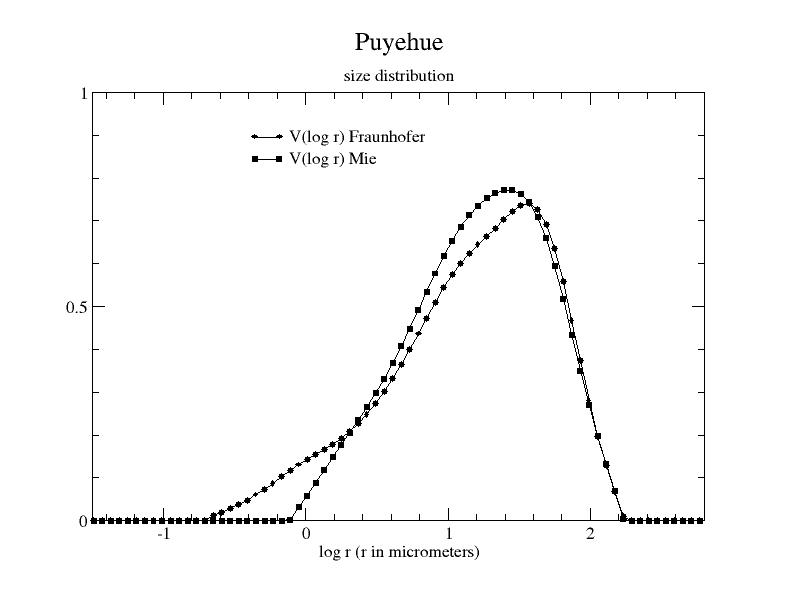
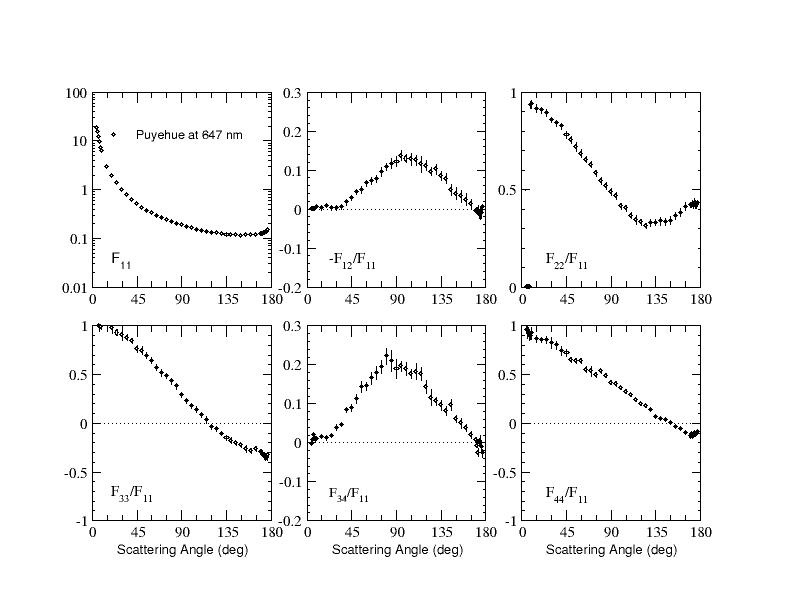
| Puyehue |
plot, table
| |
View |
647nm (plot, table) |
|
Merikallio et al. 2015
|
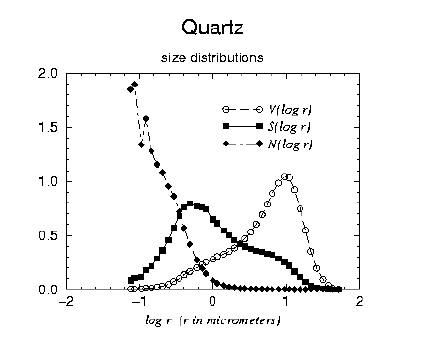
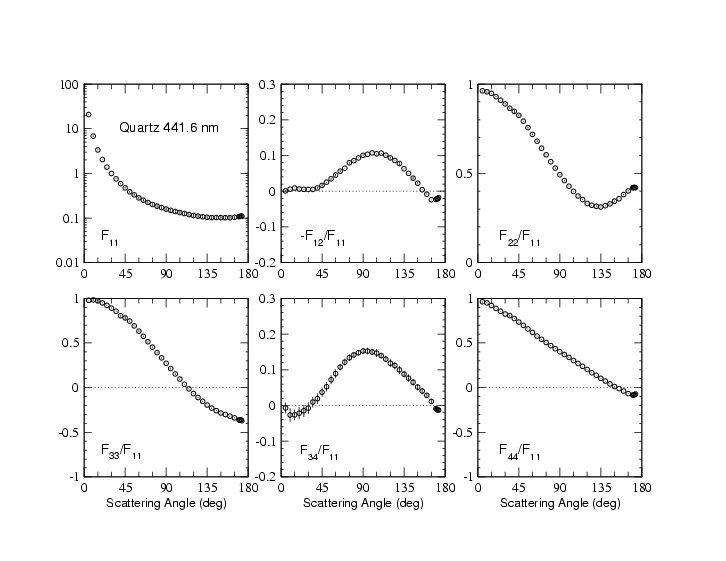
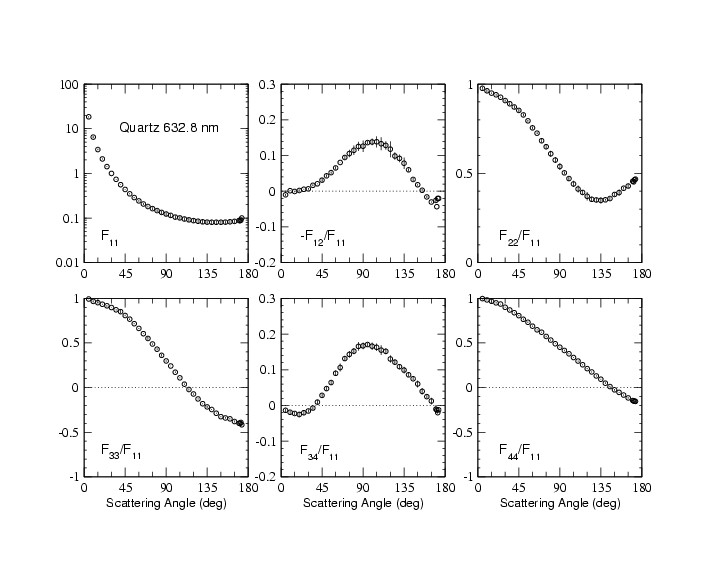
| Quartz |
plot, table |
|
View |
441.6 nm (plot, table)
632.8 nm (plot, table) |
|
Volten et al. 2001
|
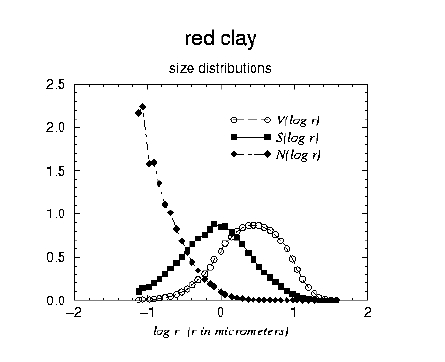
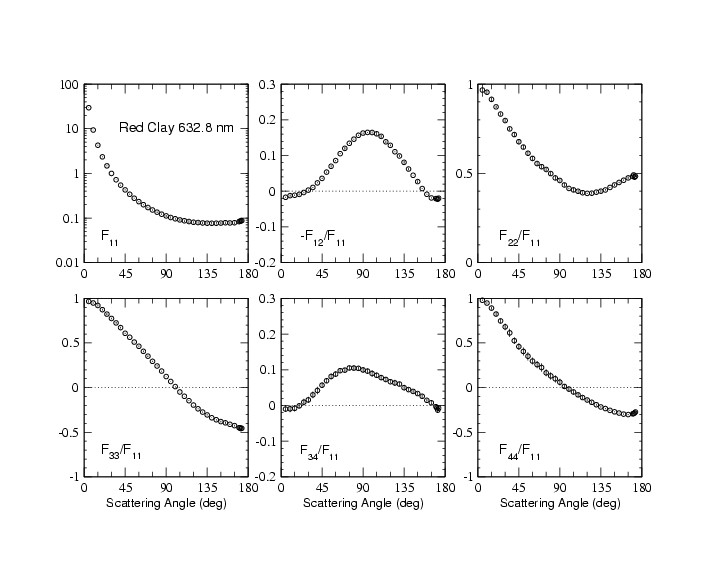
| Red Clay |
plot, table |
|
View |
441.6 nm (plot, table)
632.8 nm (plot, table) |
|
Volten et al. 2001
|
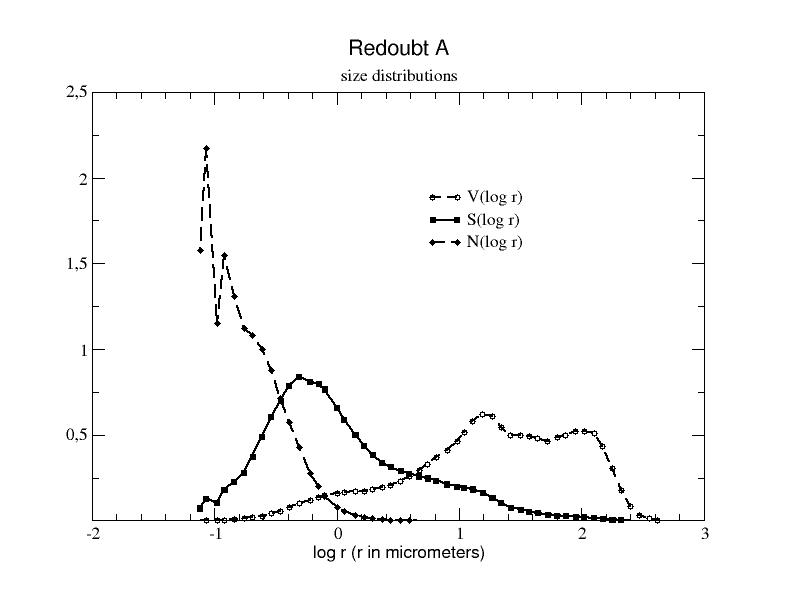
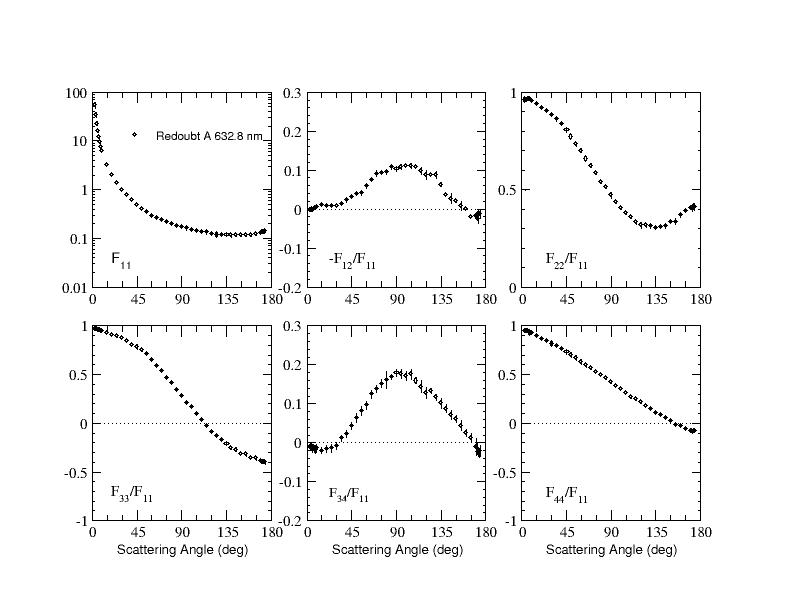
| Redoubt A |
plot, table |
|
View |
632.8 nm (plot, table) |
|
Muñoz et al. 2004
|
| Redoubt B |
plot, table |
|
View |
632.8 nm (plot, table) |
|
Muñoz et al. 2004
|
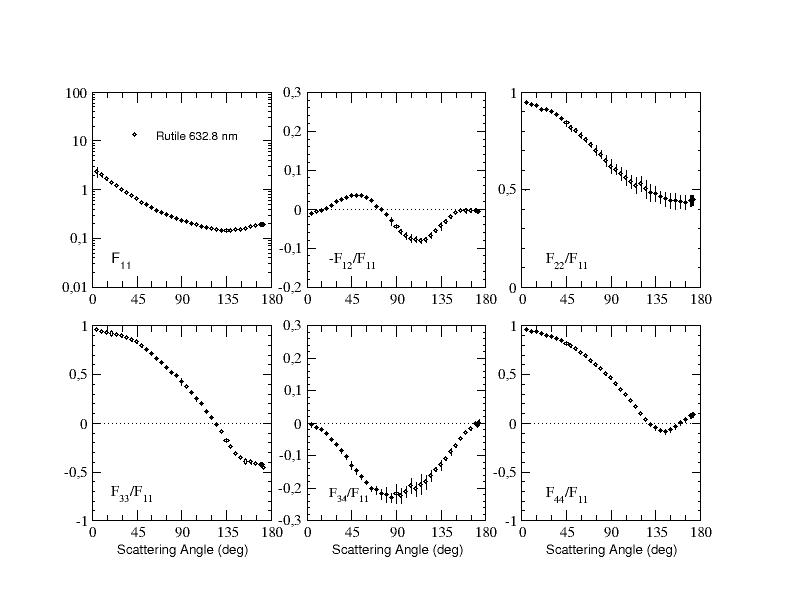
| Rutile |
|
|
View |
632.8 nm (plot, table) |
|
Muñoz et al. 2006
|
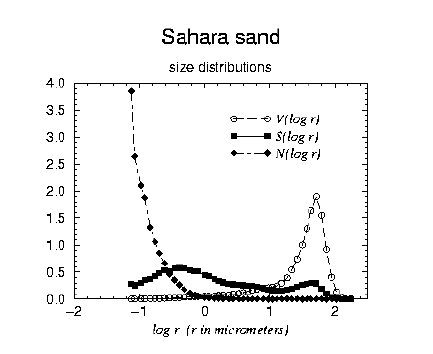
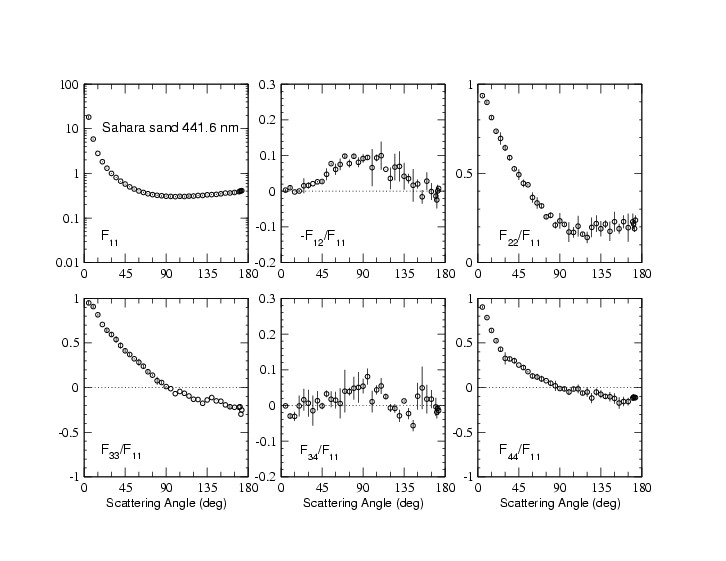
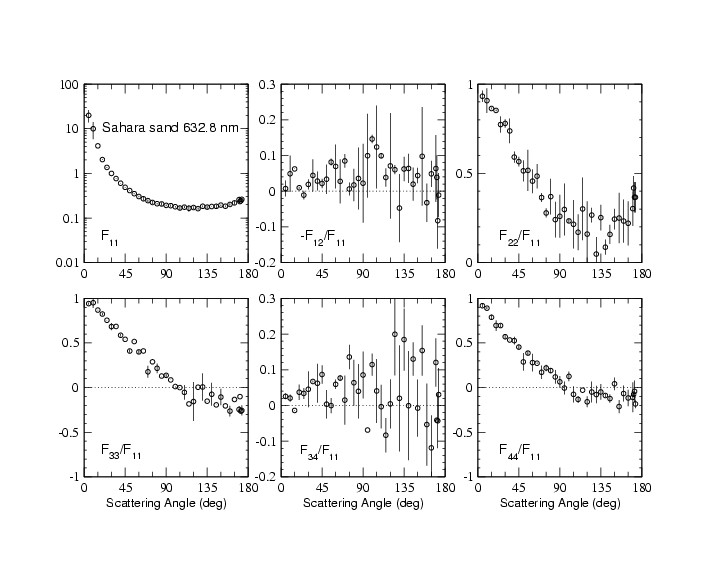
| Sahara Sand |
plot, table |
|
View |
441.6 nm (plot, table)
632.8 nm (plot, table) |
|
Volten et al. 2001
|
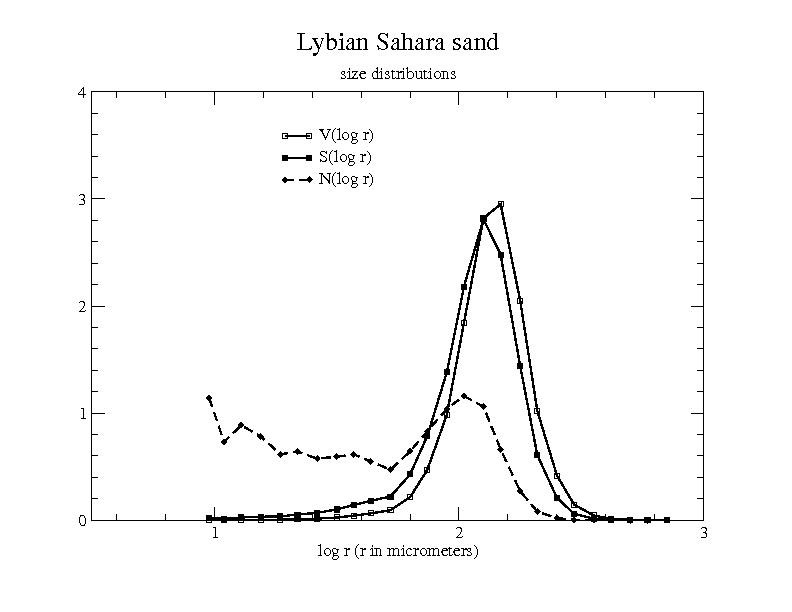
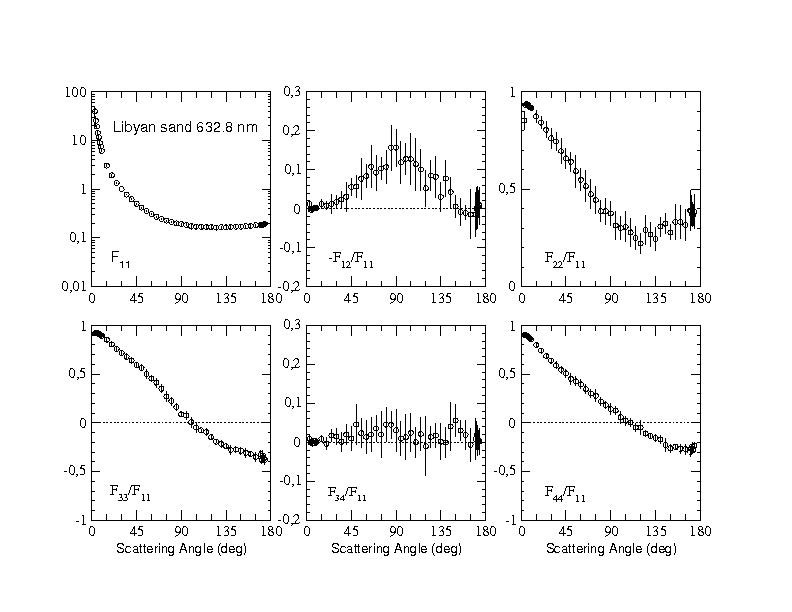
| Sahara Sand (Libya) |
plot, table |
View |
View |
632.8 nm (plot, table) |
632.8 nm (tableF) |
Muñoz et al. 2007
|
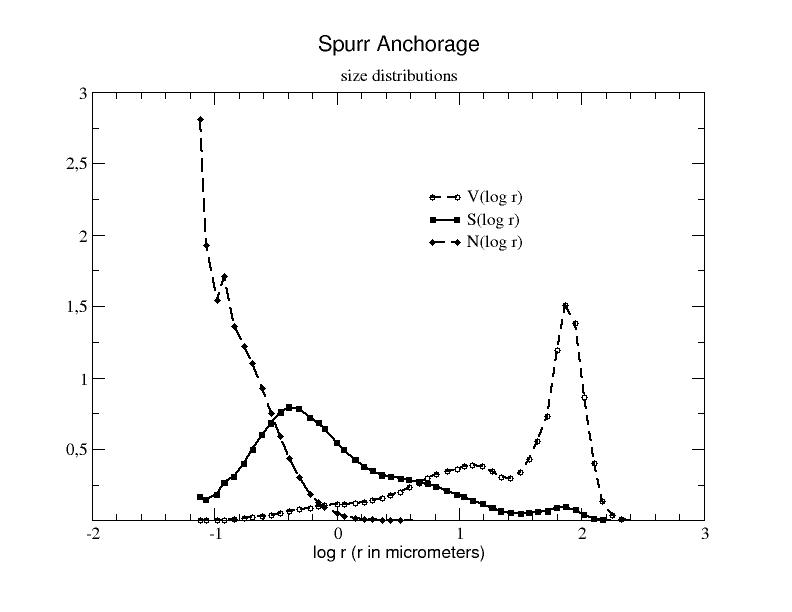
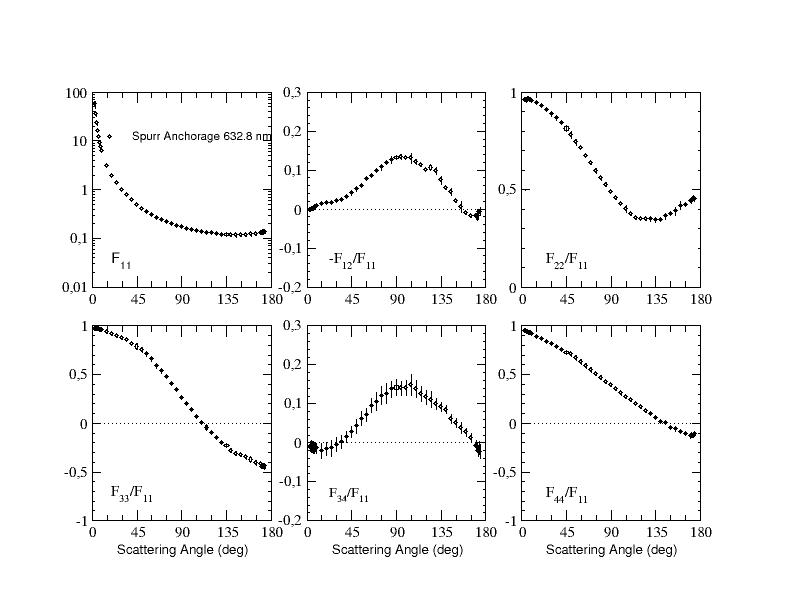
| Spurr (Anchorage) |
plot, table |
|
View |
632.8 nm (plot, table) |
|
Muñoz et al. 2004
|
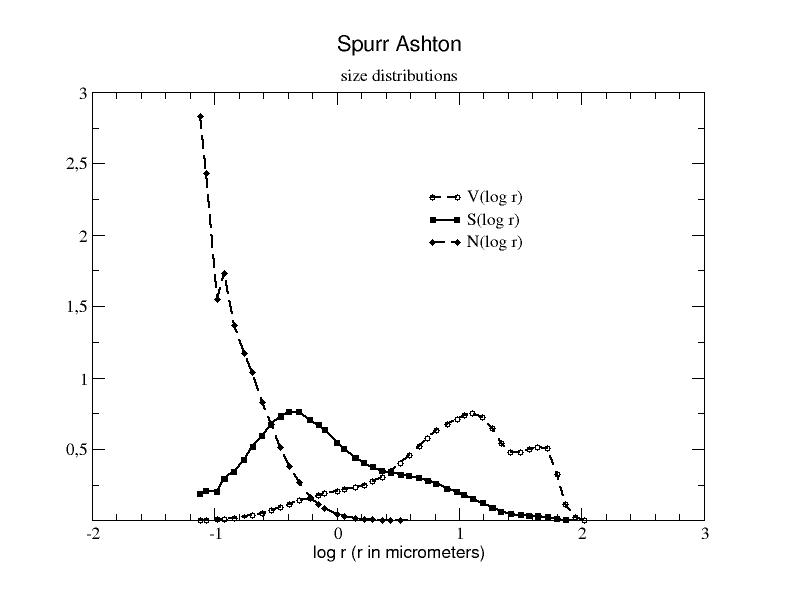
| Spurr (Ashton) |
plot, table |
|
View |
632.8 nm (plot, table) |
|
Muñoz et al. 2004
|
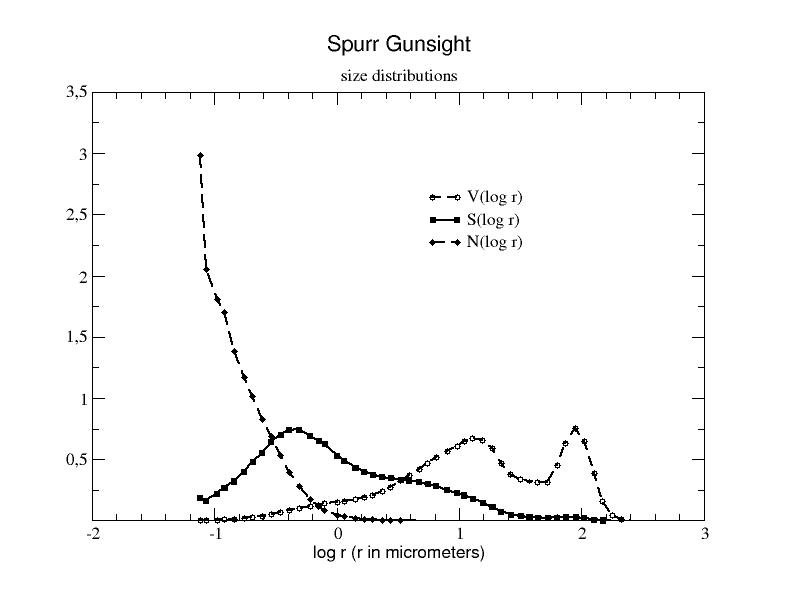
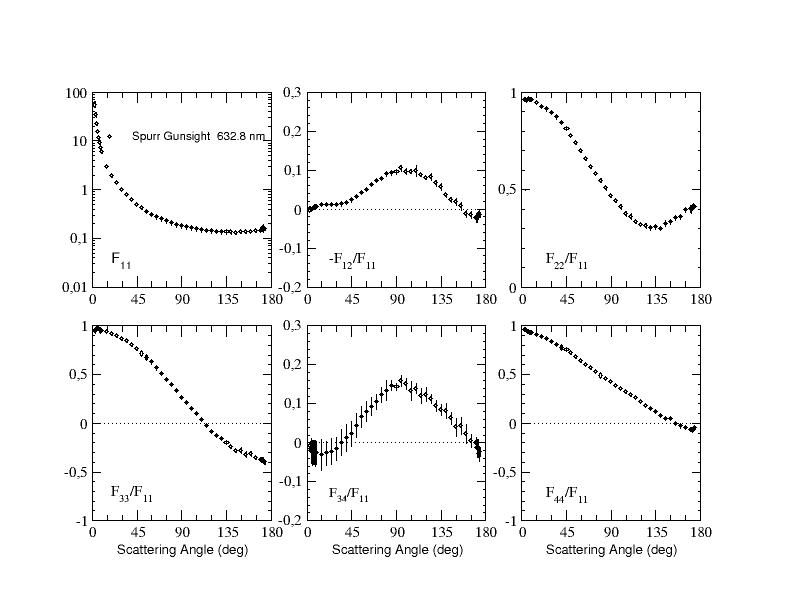
| Spurr (Gunsight) |
plot, table |
|
View |
632.8 nm (plot, table) |
|
Muñoz et al. 2004
|
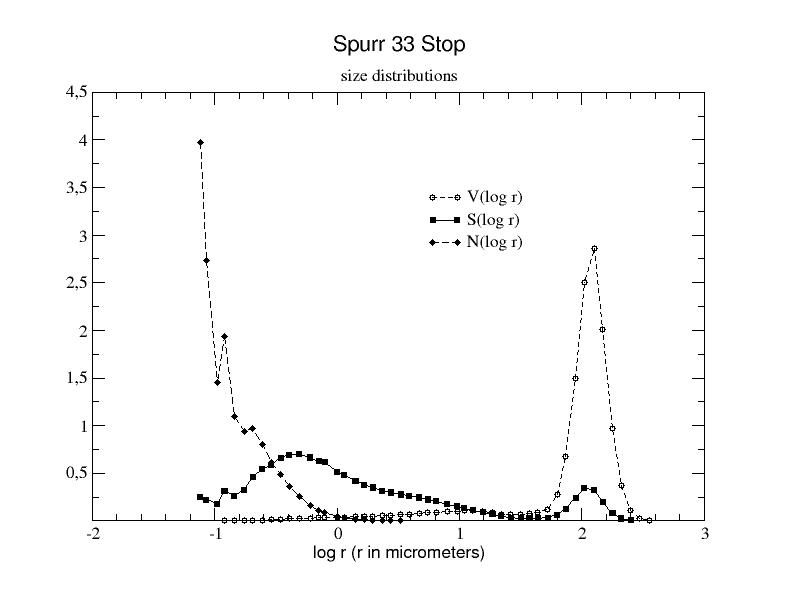
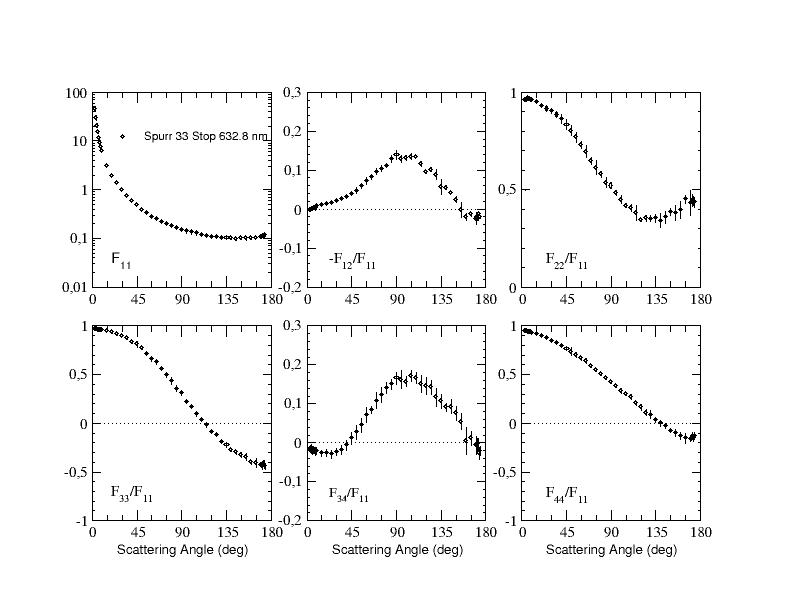
| Spurr (Stop 33) |
plot, table |
|
View |
632.8 nm (plot, table) |
|
Muñoz et al. 2004
|
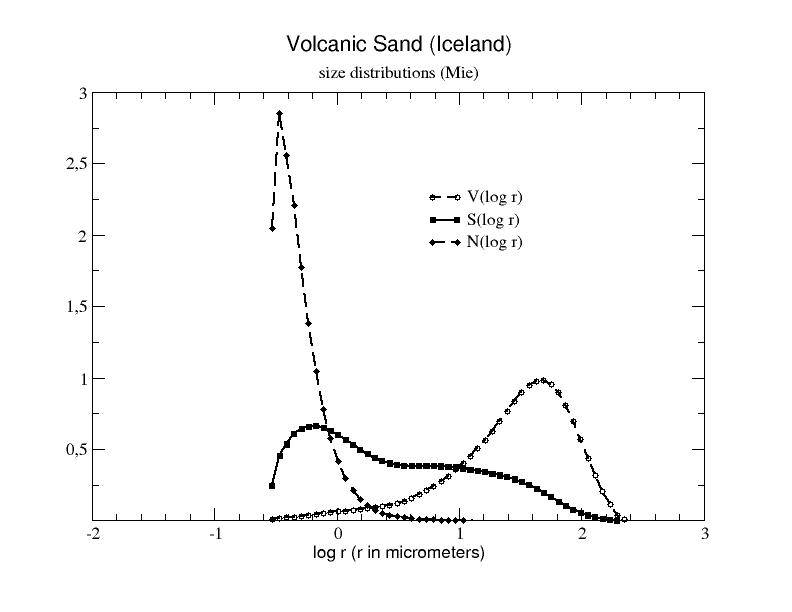
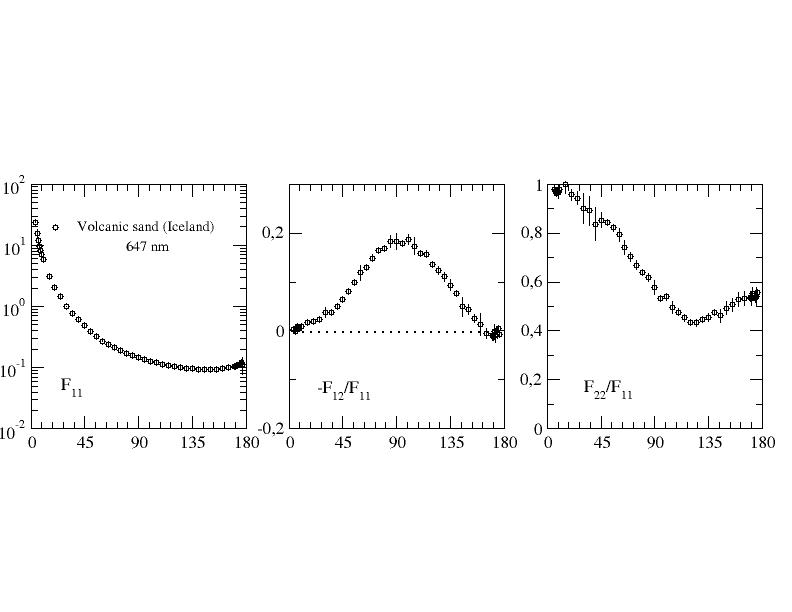
| Volcanic Sand Iceland |
plot, table
|
|
View |
647nm (plot, table) |
|
Zubko et al. 2019
|
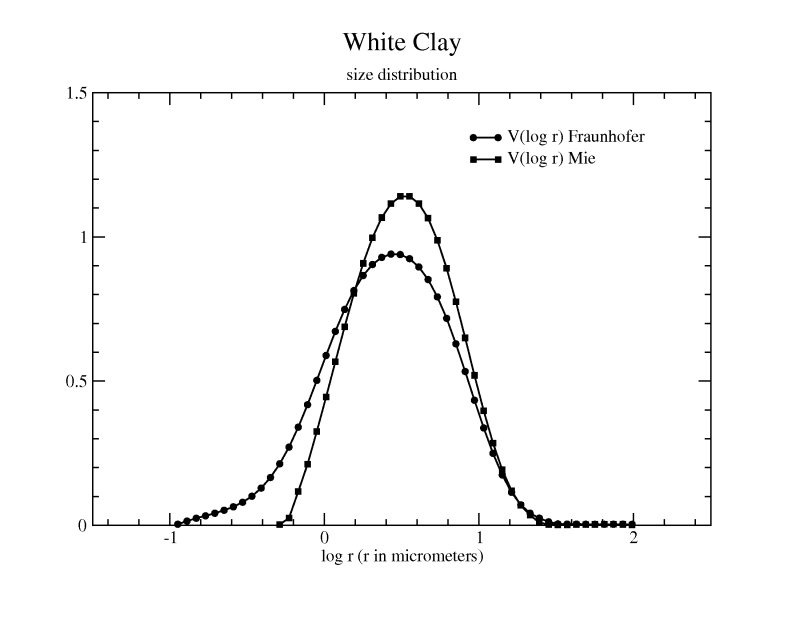
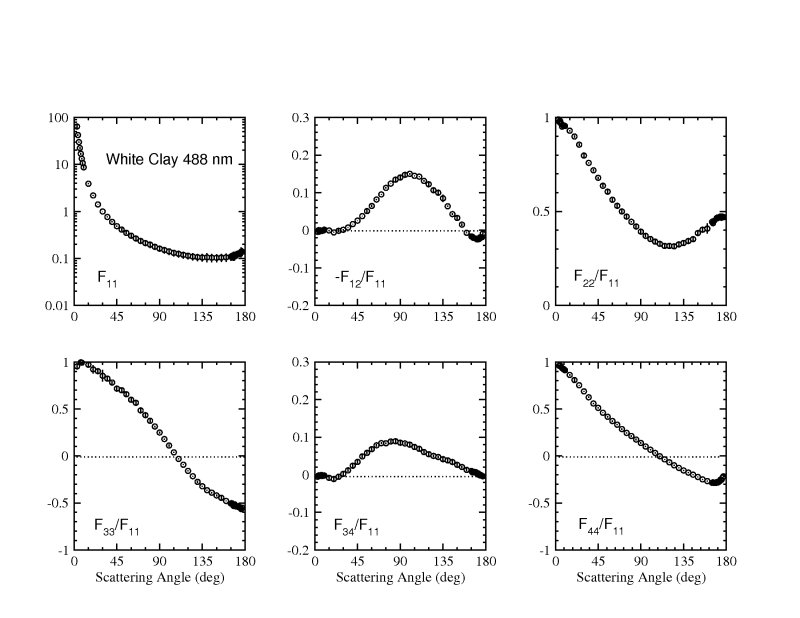
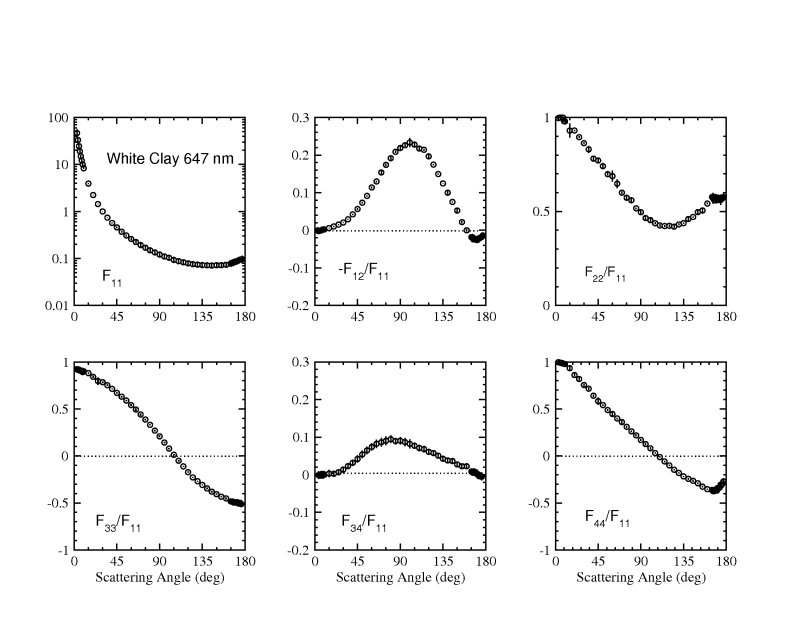
| White Clay |
plot, table |
|
View |
488nm (plot, table)
647nm (plot, table) |
|
Muñoz et al. 2011 |
